


فريقنا لديه أكثر من 7,000,000 من التجار!
كل يوم نعمل معا لتحسين التداول. نحصل على نتائج عالية ونمضي قدما.
الاعتراف من قبل الملايين من التجار في جميع أنحاء العالم هو أفضل تقدير لعملنا! لقد قمت باختيارك وسنفعل كل ما يلزم لتلبية توقعاتك!
نحن فريق رائع معا!
إنستافوركس تعتز بالعمل بالنسبة لك!


الممثل وبطل مسابقة يو إف سي 6 وبطل حقيقي!
الرجل الذي حقق النجاح بعمله الدؤوب. الرجل الذي يذهب كما نريد.
سر نجاح تاكتاروف هو حركة مستمرة نحو الهدف.
اكشف عن جميع جوانب موهبتك!
اكتشف، وحاول، وافشل - ولكن لا تتوقف أبدا!
إنستافوركس. تبدأ قصة نجاحك من هنا!
There was a tight macroeconomic calendar last Friday, which put pressure on the market. Europe's retail sales data were published, which came out slightly better than the forecast, but the growth rate slowed down from 2.6% to 1.4%. This is a fairly significant decline in consumer activity, which is the driver of economic growth. Therefore, it is not surprising that the euro declined when these statistical data were released.
The main event is considered to be the publication of the report of the US Department of Labor, which was optimistic as a whole. The unemployment rate in the country is declining at a much faster pace than experts predicted. The unemployment rate decreased from 4.6% to 4.2% with a forecast of 4.5%. This is a great signal about the recovery of the labor market.
The negative information in the report was according to employment data, where 210 thousand new jobs were created in November with a forecast of 550 thousand. The discrepancy is quite strong, so speculators immediately reacted to these data, increasing the volume of short positions on the US dollar. It is worth considering that these were only local speculations, and the report is generally not bad. So, after a while, the US dollar regained losses.
Analysis of trading charts from December 3:
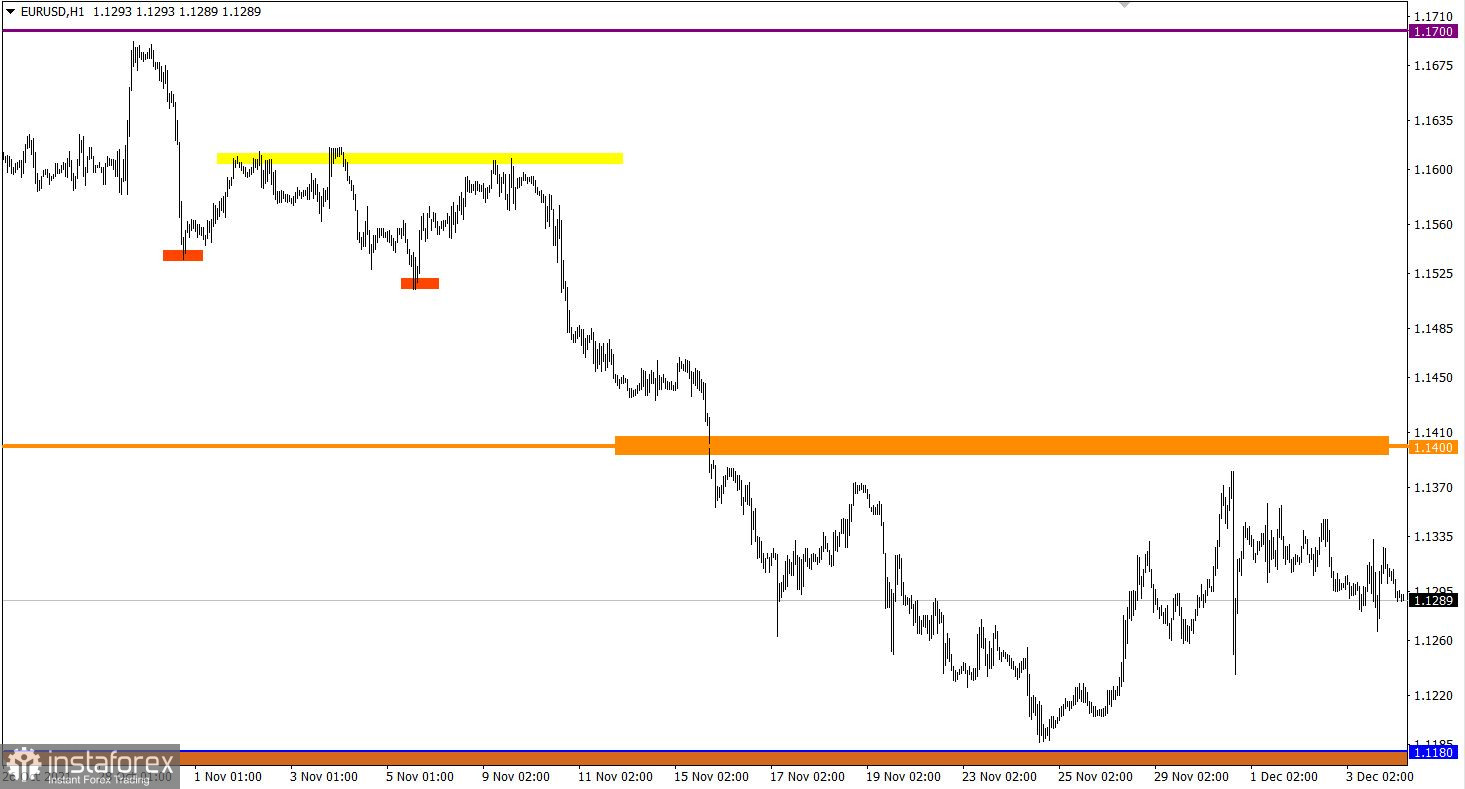
Speculation on the EUR/USD pair did not lead to anything drastic. The quote only locally dropped below the level of 1.1265, after which it returned to the area of 1.1300. This indicates a characteristic uncertainty among market participants.
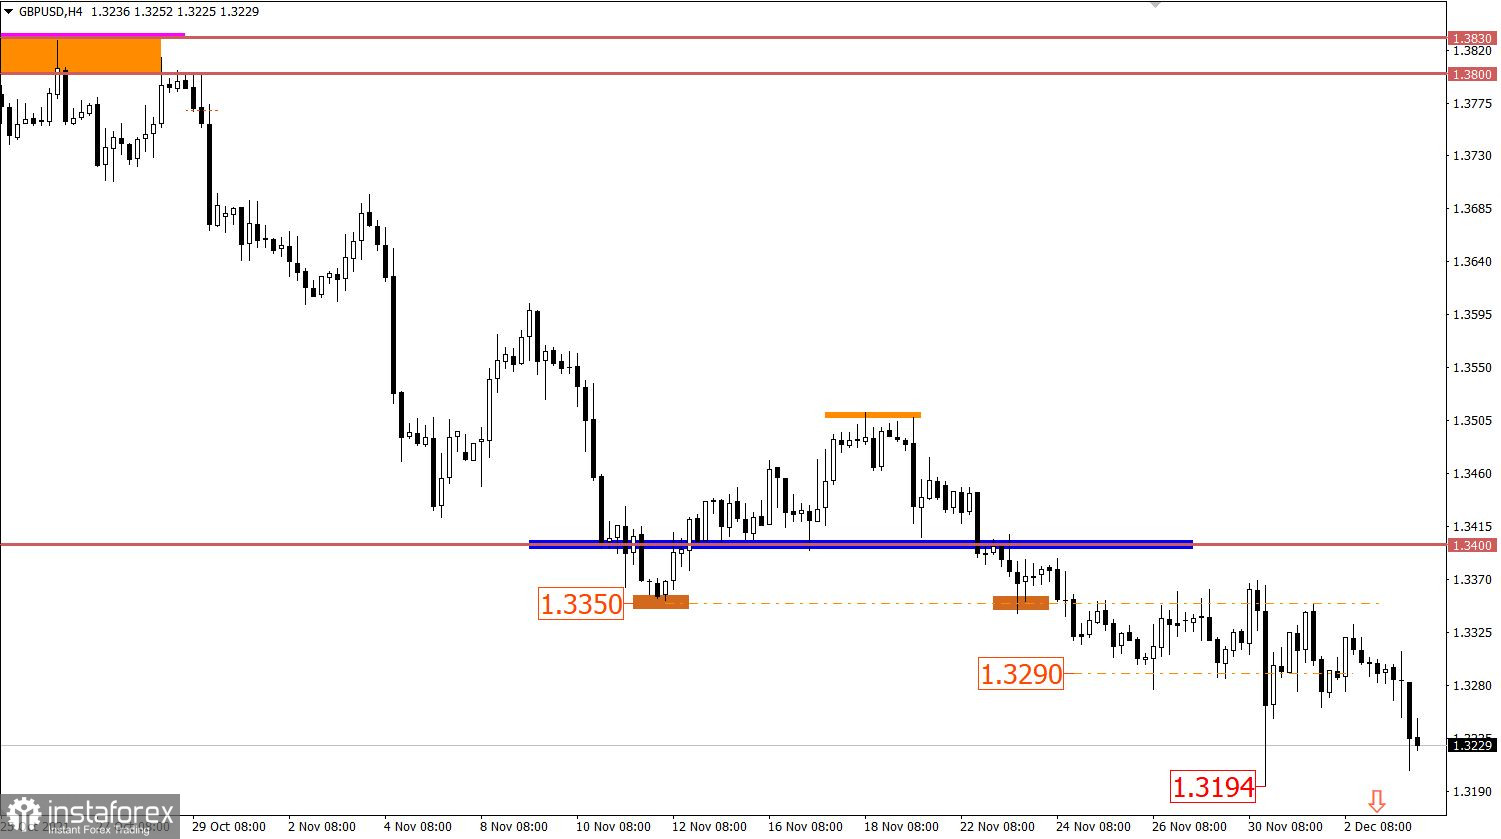
The GBP/USD pair completed forming the sideways range of 1.3290/1.3350 with downward momentum. This led to a decrease in the value of the pound sterling towards the local low (1.3194) of November 30.
Monday is traditionally accompanied by a half-empty macroeconomic calendar. The only thing one can pay attention to is the index of business activity in the UK construction sector, where there is a decline from 54.6 to 52.0 during the period of November.
The data is not the most favorable, but also not the most important in the market.
Trading plan for EUR/USD on December 6:
Despite the obvious stagnation and variable speculative nature, the market is still dominated by a downward trend. In connection with this factor, the main strategy is considered to be a downward scenario in the direction of the 1.1160/1.1180 support area.
At the same time, considering the characteristic uncertainty among market participants, it can be concluded that a flat is being built within 70/90 points.
Trading plan for GBP/USD on December 6:
In this situation, the price being held below the level of 1.3190 in an H4 period will lead to an increase in the volume of short positions. This will open the way for sellers towards the psychological level of 1.3000.
Traders will consider in the event of a price rebound from the local low of 1.3194. This can lead to a temporary correction.
A candlestick chart view is graphical rectangles of white and black light, with sticks on top and bottom. When analyzing each candle in detail, you will see its characteristics of a relative period: the opening price, closing price, and maximum and minimum prices.
Horizontal levels are price coordinates, relative to which a stop or a price reversal may occur. These levels are called support and resistance in the market.
Circles and rectangles are highlighted examples where the price of the story unfolded. This color selection indicates horizontal lines that may put pressure on the quote in the future.
The up/down arrows are the reference points of the possible price direction in the future.
*The market analysis posted here is meant to increase your awareness, but not to give instructions to make a trade.
InstaSpot analytical reviews will make you fully aware of market trends! Being an InstaSpot client, you are provided with a large number of free services for efficient trading.


