


الأسطورة فى فريق إنستافوركس!
الأسطورة! هل تعتقد أن هذا هو الخطاب المنمق؟ ولكن كيف ينبغي أن نطلق على الرجل، الذي أصبح أول آسيوي يفوز ببطولة العالم للشطرنج للشباب بعمر 18 سنة والذي أصبح أول أستاذ كبير هندي في سن 19؟ وكانت هذه بداية طريق صعب إلى لقب بطل العالم لـ فيسواناثان أناند، الرجل الذي أصبح جزءًا من تاريخ الشطرنج إلى الأبد. والآن أسطورة آخر في فريق إنستافوركس!


يعتبر بوروسيا دورتموند أحد أكثر أندية كرة القدم حصولاً على الألقاب في ألمانيا، وقد أثبت ذلك مرارًا وتكرارًا للجماهير: فإنّ روح المنافسة والقيادة ستؤدي بالتأكيد إلى النجاح. قم بالتداول بنفس الطريقة التي يلعب بها المحترفون الرياضيون اللعبة: بثقة ونشاط. احتفظ بـ "ترخيص دخول" من نادي بوروسيا دورتموند لكرة القدم وكن في الصدارة مع إنستافوركس!
The price of Bitcoin rallied in the short term and now it stands below strong dynamic resistance. It's traded at 40,394 at the time of writing far above yesterday's low of 38,202. BTC/USD increased by 6.80% from yesterday's low to 40,800 today's high.
After its aggressive rally, we cannot exclude a temporary drop. Larger growth needs strong confirmation. In the short term, it moves somehow sideways. In the last 24 hours, BTC/USD is up by 3.78% but it's down by 1.69% in the last 7 days.
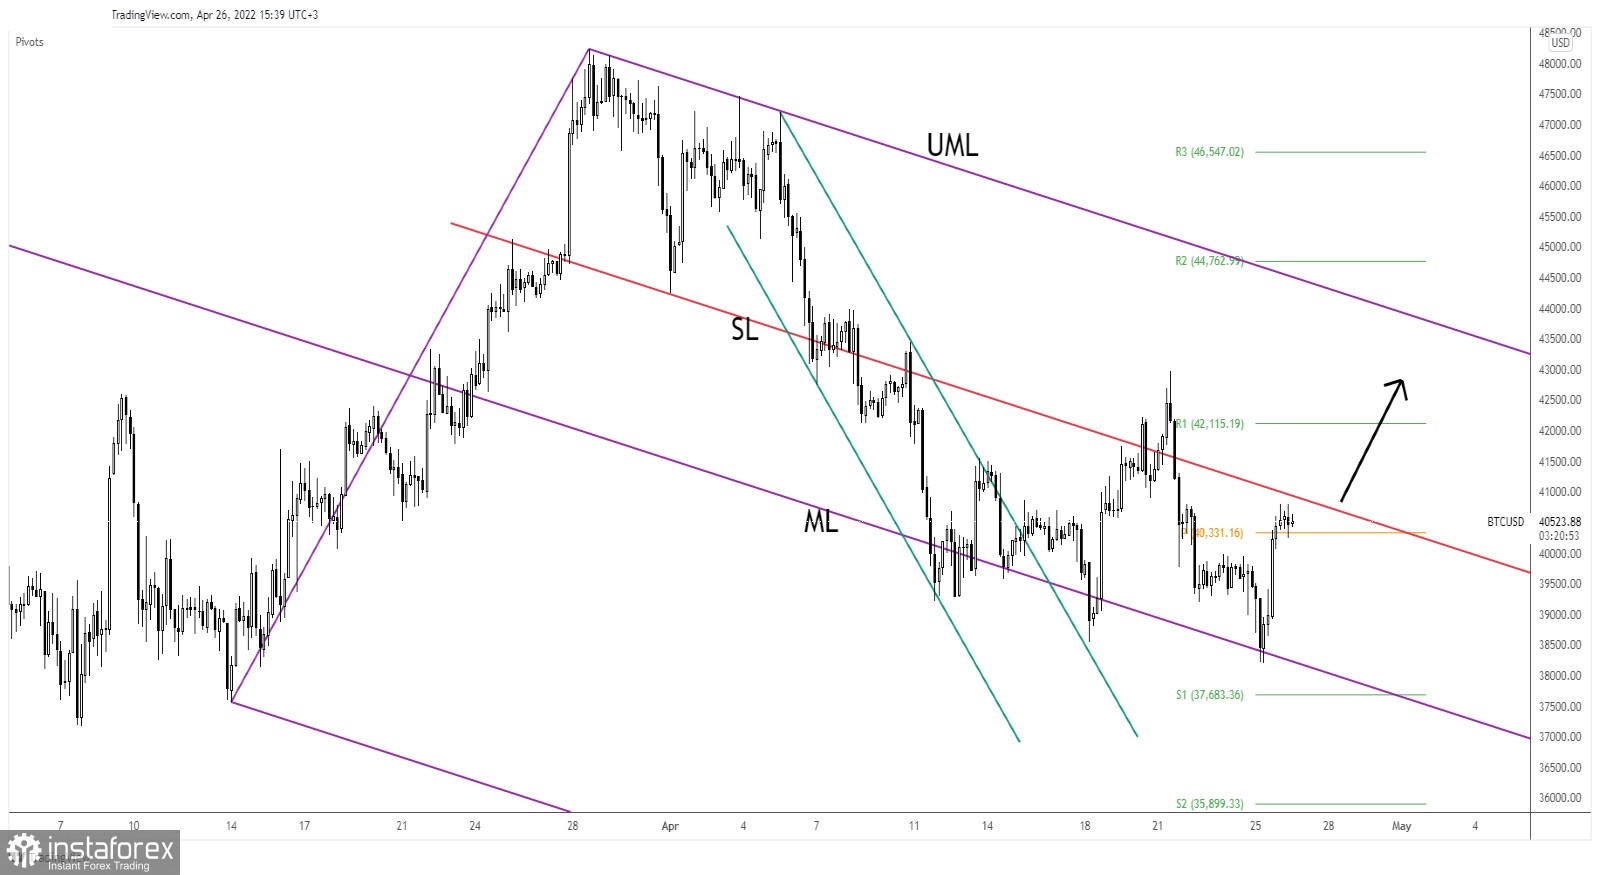
BTC/USD found support on the descending pitchfork's median line (ML) and now is traded around the weekly pivot point of 40,331. As you can see on the H4 chart, the crypto failed to reach and retest the inside sliding line (SL) which represents a dynamic resistance.
Making a valid breakout above this level may signal potential further growth. The median line (ML) and 38,547 low represent strong downside obstacles. False breakouts above the sliding line (SL) or its failure to reach this dynamic resistance may signal a new sell-off.
Jumping and closing above 40,800 today's high and above the sliding line (SL) could confirm an upside continuation and could bring new buying opportunities.
*The market analysis posted here is meant to increase your awareness, but not to give instructions to make a trade.
InstaSpot analytical reviews will make you fully aware of market trends! Being an InstaSpot client, you are provided with a large number of free services for efficient trading.


