


الأسطورة فى فريق إنستافوركس!
الأسطورة! هل تعتقد أن هذا هو الخطاب المنمق؟ ولكن كيف ينبغي أن نطلق على الرجل، الذي أصبح أول آسيوي يفوز ببطولة العالم للشطرنج للشباب بعمر 18 سنة والذي أصبح أول أستاذ كبير هندي في سن 19؟ وكانت هذه بداية طريق صعب إلى لقب بطل العالم لـ فيسواناثان أناند، الرجل الذي أصبح جزءًا من تاريخ الشطرنج إلى الأبد. والآن أسطورة آخر في فريق إنستافوركس!


يعتبر بوروسيا دورتموند أحد أكثر أندية كرة القدم حصولاً على الألقاب في ألمانيا، وقد أثبت ذلك مرارًا وتكرارًا للجماهير: فإنّ روح المنافسة والقيادة ستؤدي بالتأكيد إلى النجاح. قم بالتداول بنفس الطريقة التي يلعب بها المحترفون الرياضيون اللعبة: بثقة ونشاط. احتفظ بـ "ترخيص دخول" من نادي بوروسيا دورتموند لكرة القدم وكن في الصدارة مع إنستافوركس!
EUR/USD continues to trade in a relatively narrow channel below 1.1000 on Monday. The data from the US showed a small decline in the international trade deficit in February and the US Dollar Index stays in positive territory above 99.00. Meanwhile, retreating US T-bond yields seem to be capping the dollar's gains for the time being.
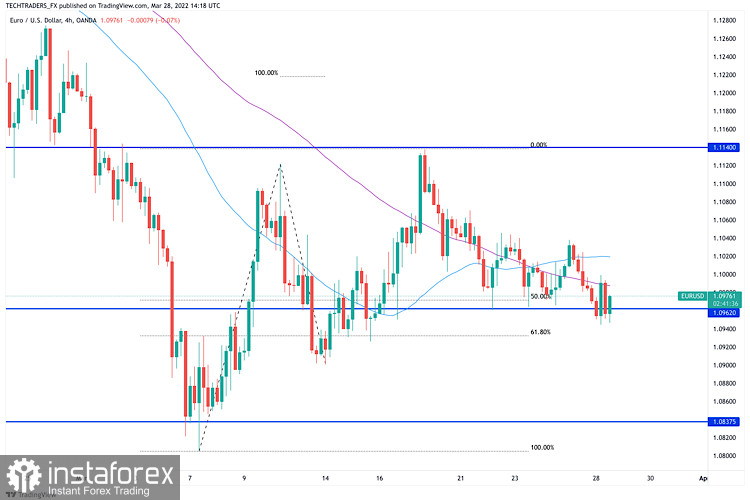
The EUR/USD pair is currently trading in the 1.0950 price zone, hovering around a Fibonacci level, the 23.6% retracement of its 2022 slide. The daily chart shows that the pair is down for a fourth consecutive day, meeting sellers around a firmly bearish 20 SMA. The Momentum indicator turned south but stands within neutral levels, while the RSI is heading lower at around 40.
The near-term picture is neutral-to-bearish, as the 4-hour chart shows that converging 20 and 100 SMAs cap the upside, with mildly bearish slopes. Technical indicators, in the meantime, are within negative levels, without clear directional strength. The odds are that the US dollar is set to assert strength, making EUR/USD break below 1.0920, exposing the year's low at 1.0805.
Support levels: 1.0920 1.0875 1.0840
Resistance levels: 1.1020 1.1070 1.1105
*The market analysis posted here is meant to increase your awareness, but not to give instructions to make a trade.
InstaSpot analytical reviews will make you fully aware of market trends! Being an InstaSpot client, you are provided with a large number of free services for efficient trading.


