


الأسطورة فى فريق إنستافوركس!
الأسطورة! هل تعتقد أن هذا هو الخطاب المنمق؟ ولكن كيف ينبغي أن نطلق على الرجل، الذي أصبح أول آسيوي يفوز ببطولة العالم للشطرنج للشباب بعمر 18 سنة والذي أصبح أول أستاذ كبير هندي في سن 19؟ وكانت هذه بداية طريق صعب إلى لقب بطل العالم لـ فيسواناثان أناند، الرجل الذي أصبح جزءًا من تاريخ الشطرنج إلى الأبد. والآن أسطورة آخر في فريق إنستافوركس!


يعتبر بوروسيا دورتموند أحد أكثر أندية كرة القدم حصولاً على الألقاب في ألمانيا، وقد أثبت ذلك مرارًا وتكرارًا للجماهير: فإنّ روح المنافسة والقيادة ستؤدي بالتأكيد إلى النجاح. قم بالتداول بنفس الطريقة التي يلعب بها المحترفون الرياضيون اللعبة: بثقة ونشاط. احتفظ بـ "ترخيص دخول" من نادي بوروسيا دورتموند لكرة القدم وكن في الصدارة مع إنستافوركس!
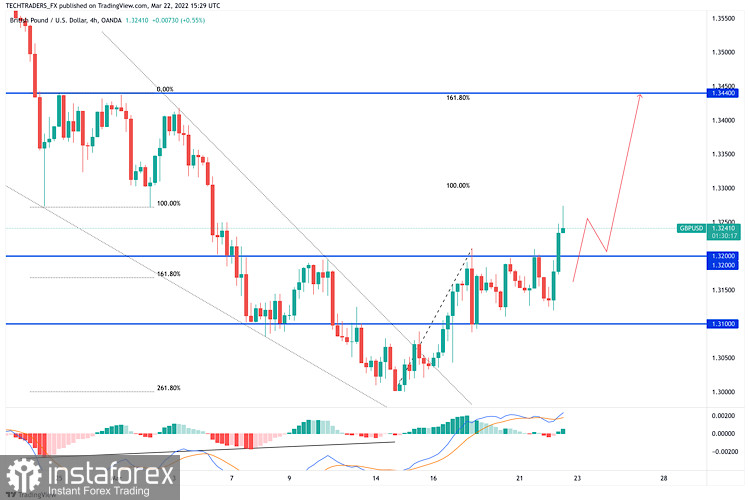
GBP/USD maintains its bullish momentum in the American session, trading at its highest level in two weeks above 1.3250. The risk-positive market environment, as reflected by rising European and US stock indices, seems to be weighing on the dollar.
On the four-hour chart, GBP/USD is testing the 100-period SMA, which forms interim resistance at 1.3180 ahead of the critical 1.3200 (psychological level, Fibonacci 50% retracement of the latest downtrend) hurdle.
Meanwhile, the Relative Strength Index (RSI) indicator is holding above 50 on the same chart, suggesting that buyers are looking to take control of the pair's action. In case 1.3200 level turns into support, the next bullish target could be seen at 1.3250 (Fibonacci 61.8% retracement).
On the downside, 1.3150 (Fibonacci 38.2% retracement) aligns as first support before 1.3100 (50-period SMA, Fibonacci 23.6% retracement, psychological level).
*The market analysis posted here is meant to increase your awareness, but not to give instructions to make a trade.
InstaSpot analytical reviews will make you fully aware of market trends! Being an InstaSpot client, you are provided with a large number of free services for efficient trading.


