


فريقنا لديه أكثر من 7,000,000 من التجار!
كل يوم نعمل معا لتحسين التداول. نحصل على نتائج عالية ونمضي قدما.
الاعتراف من قبل الملايين من التجار في جميع أنحاء العالم هو أفضل تقدير لعملنا! لقد قمت باختيارك وسنفعل كل ما يلزم لتلبية توقعاتك!
نحن فريق رائع معا!
إنستافوركس تعتز بالعمل بالنسبة لك!


الممثل وبطل مسابقة يو إف سي 6 وبطل حقيقي!
الرجل الذي حقق النجاح بعمله الدؤوب. الرجل الذي يذهب كما نريد.
سر نجاح تاكتاروف هو حركة مستمرة نحو الهدف.
اكشف عن جميع جوانب موهبتك!
اكتشف، وحاول، وافشل - ولكن لا تتوقف أبدا!
إنستافوركس. تبدأ قصة نجاحك من هنا!
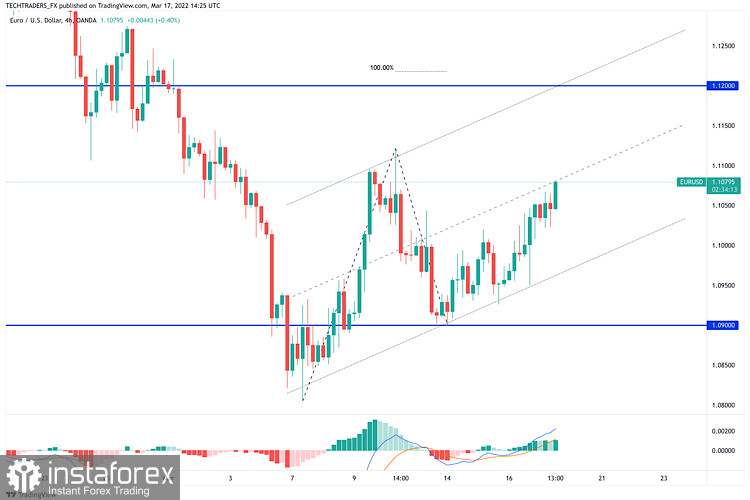
EUR/USD continues to push higher on Thursday and trades at its highest level in a week above 1.1070. The broad-based selling pressure surrounding the dollar and the positive shift witnessed in risk sentiment helps the pair preserve its bullish momentum.
The EUR/USD pair is nearing a critical Fibonacci resistance level at 1.1070, the 38.2% retracement of its latest daily slide. The daily chart shows that technical indicators have lost their bullish momentum within negative levels, while the 20 SMA heads firmly lower, now around 1.1095. The bullish potential remains limited, although a break above the Fibonacci resistance may spook sellers and favor a continuation.
The near term picture is mildly bullish, as the 4-hour chart shows that technical indicators have lost their upward strength but that they remain well above their midlines. Additionally, the pair is developing above a bullish 20 SMA, while a bearish 100 SMA is acting as dynamic resistance around the aforementioned daily high.
Support levels: 1.1000 1.0965 1.0900
Resistance levels: 1.1070 1.1115 1.1160
*The market analysis posted here is meant to increase your awareness, but not to give instructions to make a trade.
InstaSpot analytical reviews will make you fully aware of market trends! Being an InstaSpot client, you are provided with a large number of free services for efficient trading.


