


الأسطورة فى فريق إنستافوركس!
الأسطورة! هل تعتقد أن هذا هو الخطاب المنمق؟ ولكن كيف ينبغي أن نطلق على الرجل، الذي أصبح أول آسيوي يفوز ببطولة العالم للشطرنج للشباب بعمر 18 سنة والذي أصبح أول أستاذ كبير هندي في سن 19؟ وكانت هذه بداية طريق صعب إلى لقب بطل العالم لـ فيسواناثان أناند، الرجل الذي أصبح جزءًا من تاريخ الشطرنج إلى الأبد. والآن أسطورة آخر في فريق إنستافوركس!


يعتبر بوروسيا دورتموند أحد أكثر أندية كرة القدم حصولاً على الألقاب في ألمانيا، وقد أثبت ذلك مرارًا وتكرارًا للجماهير: فإنّ روح المنافسة والقيادة ستؤدي بالتأكيد إلى النجاح. قم بالتداول بنفس الطريقة التي يلعب بها المحترفون الرياضيون اللعبة: بثقة ونشاط. احتفظ بـ "ترخيص دخول" من نادي بوروسيا دورتموند لكرة القدم وكن في الصدارة مع إنستافوركس!
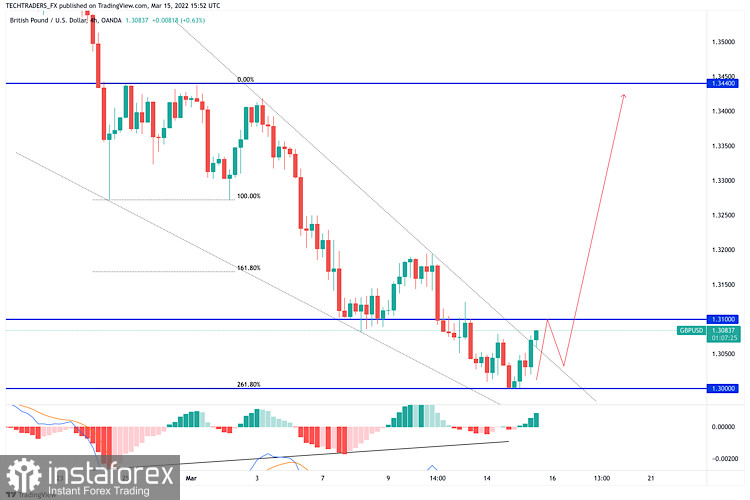
GBP/USD staled its early advance below the 1.3100 figure, now stable at around 1.3060. Upbeat UK employment figures maintain the British Pound afloat, despite increased demand for the greenback.
The Relative Strength Index (RSI) indicator on the four-hour chart stays near 40 and GBP/USD continues to trade below the 20-period SMA, suggesting that buyers are yet to control the pair's action.
Moreover, 4-hourly MACD has diverged in favor of the bulls. MACD histograms has produced higher lows , contradicting lower lows on the price chart. That bullish divergence indicates a potential for a corrective bounce which confirms the reversal chart pattern formation ( falling wedge) after the breakout of pattern.
1.3000 (psychological level, static level) aligns as significant support and additional losses toward 1.2920 (static level) could be witnessed in case this level turns into resistance.
Resistances are located at 1.3050 (static level, 20-period SMA), 1.3100 (psychological level, static level) and 1.3150 (static level, 50-period SMA).
*The market analysis posted here is meant to increase your awareness, but not to give instructions to make a trade.
InstaSpot analytical reviews will make you fully aware of market trends! Being an InstaSpot client, you are provided with a large number of free services for efficient trading.


