


فريقنا لديه أكثر من 7,000,000 من التجار!
كل يوم نعمل معا لتحسين التداول. نحصل على نتائج عالية ونمضي قدما.
الاعتراف من قبل الملايين من التجار في جميع أنحاء العالم هو أفضل تقدير لعملنا! لقد قمت باختيارك وسنفعل كل ما يلزم لتلبية توقعاتك!
نحن فريق رائع معا!
إنستافوركس تعتز بالعمل بالنسبة لك!


الممثل وبطل مسابقة يو إف سي 6 وبطل حقيقي!
الرجل الذي حقق النجاح بعمله الدؤوب. الرجل الذي يذهب كما نريد.
سر نجاح تاكتاروف هو حركة مستمرة نحو الهدف.
اكشف عن جميع جوانب موهبتك!
اكتشف، وحاول، وافشل - ولكن لا تتوقف أبدا!
إنستافوركس. تبدأ قصة نجاحك من هنا!
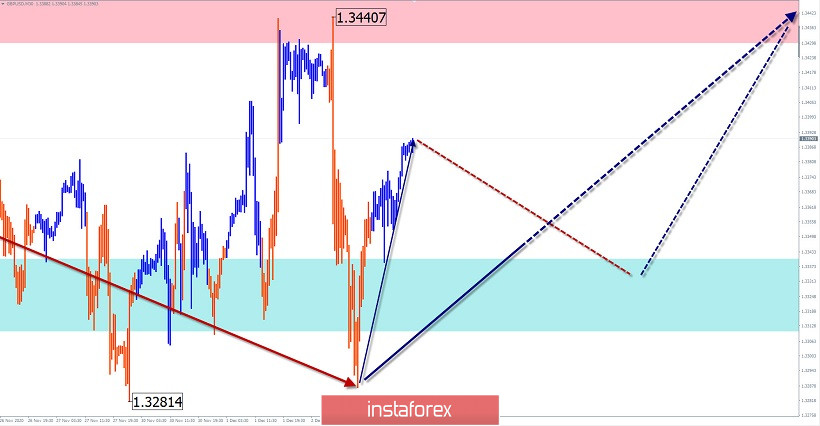
GBP/USD
Analysis:
An upward wave has been developing on the chart of the British pound since mid-October. The unfinished section has been reporting since November 2. It completed the oncoming correctional movement in the form of a horizontal shifting plane. The upward section that started yesterday has a reversal potential and can be the beginning of a new wave along with the trend.
Forecast:
In the first half of the day, a flat is likely, with a descending vector. By the end of the day, you can expect activation and a price rise in the area of the calculated resistance. A further break up is not excluded today.
Potential reversal zones
Resistance:
- 1.3430/1.3460
Support:
- 1.3340/1.3310
Recommendations:
Sales on the British pound market today are very risky and are not recommended. The main attention should be paid to finding places to enter long positions.
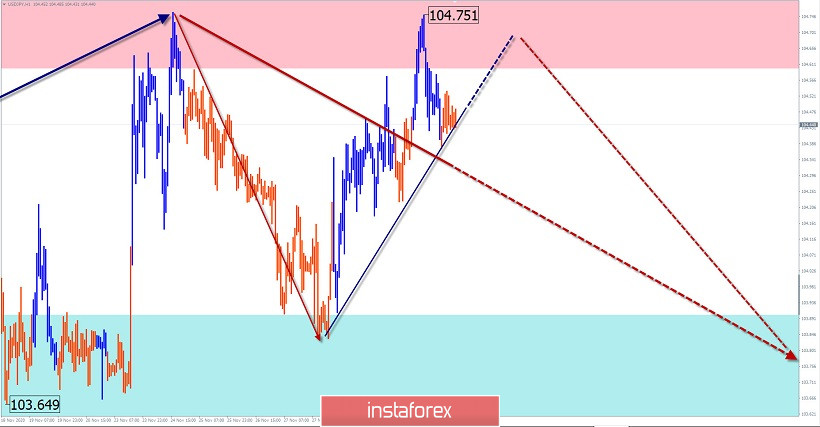
USD/JPY
Analysis:
Since November 9, a descending wave structure has been forming on the Japanese yen chart. Its structure lacks the final section. At the time of analysis, the price is at the lower limit of the resistance zone of a large time frame.
Forecast:
In the next 24 hours, the pair's market will end its upward movement. Then you can wait for a reversal and the beginning of an intensive decline. Calculated support shows the lower limit of the expected range of the daily move.
Potential reversal zones
Resistance:
- 104.60/104.90
Support:
- 103.90/103.60
Recommendations:
There are no conditions for buying the Japanese yen today. In the area of the calculated resistance, it is recommended to track all emerging signals for selling the instrument.
Explanation: In the simplified wave analysis (UVA), waves consist of 3 parts (A-B-C). The last incomplete wave is analyzed. The solid background of the arrows shows the formed structure, and the dotted background shows the expected movements.
Note: The wave algorithm does not take into account the duration of the instrument's movements in time!
*The market analysis posted here is meant to increase your awareness, but not to give instructions to make a trade.
InstaSpot analytical reviews will make you fully aware of market trends! Being an InstaSpot client, you are provided with a large number of free services for efficient trading.


