


الأسطورة فى فريق إنستافوركس!
الأسطورة! هل تعتقد أن هذا هو الخطاب المنمق؟ ولكن كيف ينبغي أن نطلق على الرجل، الذي أصبح أول آسيوي يفوز ببطولة العالم للشطرنج للشباب بعمر 18 سنة والذي أصبح أول أستاذ كبير هندي في سن 19؟ وكانت هذه بداية طريق صعب إلى لقب بطل العالم لـ فيسواناثان أناند، الرجل الذي أصبح جزءًا من تاريخ الشطرنج إلى الأبد. والآن أسطورة آخر في فريق إنستافوركس!


يعتبر بوروسيا دورتموند أحد أكثر أندية كرة القدم حصولاً على الألقاب في ألمانيا، وقد أثبت ذلك مرارًا وتكرارًا للجماهير: فإنّ روح المنافسة والقيادة ستؤدي بالتأكيد إلى النجاح. قم بالتداول بنفس الطريقة التي يلعب بها المحترفون الرياضيون اللعبة: بثقة ونشاط. احتفظ بـ "ترخيص دخول" من نادي بوروسيا دورتموند لكرة القدم وكن في الصدارة مع إنستافوركس!
Gold is trading in the red at 1,843.48 level at the time of writing. The bias is bearish in the short term after failing to make a new higher high. Also, DXY's rally forced the yellow metal to lose altitude.
In the short term, a temporary decline was somehow expected after its last swing higher. It could test and retest the immediate support levels before jumping higher. As long as it stays above the near-term downside obstacles, XAU/USD could still increase. Today, the Eurozone Consumer Confidence, the US Existing Home Sales, and the New Zealand retail sales data could bring more volatility in Gold.
Tomorrow, the US and the Eurozone manufacturing and services data could be decisive. Still, DXY could be too overbought to be able to extend its growth before registering a temporary correction.
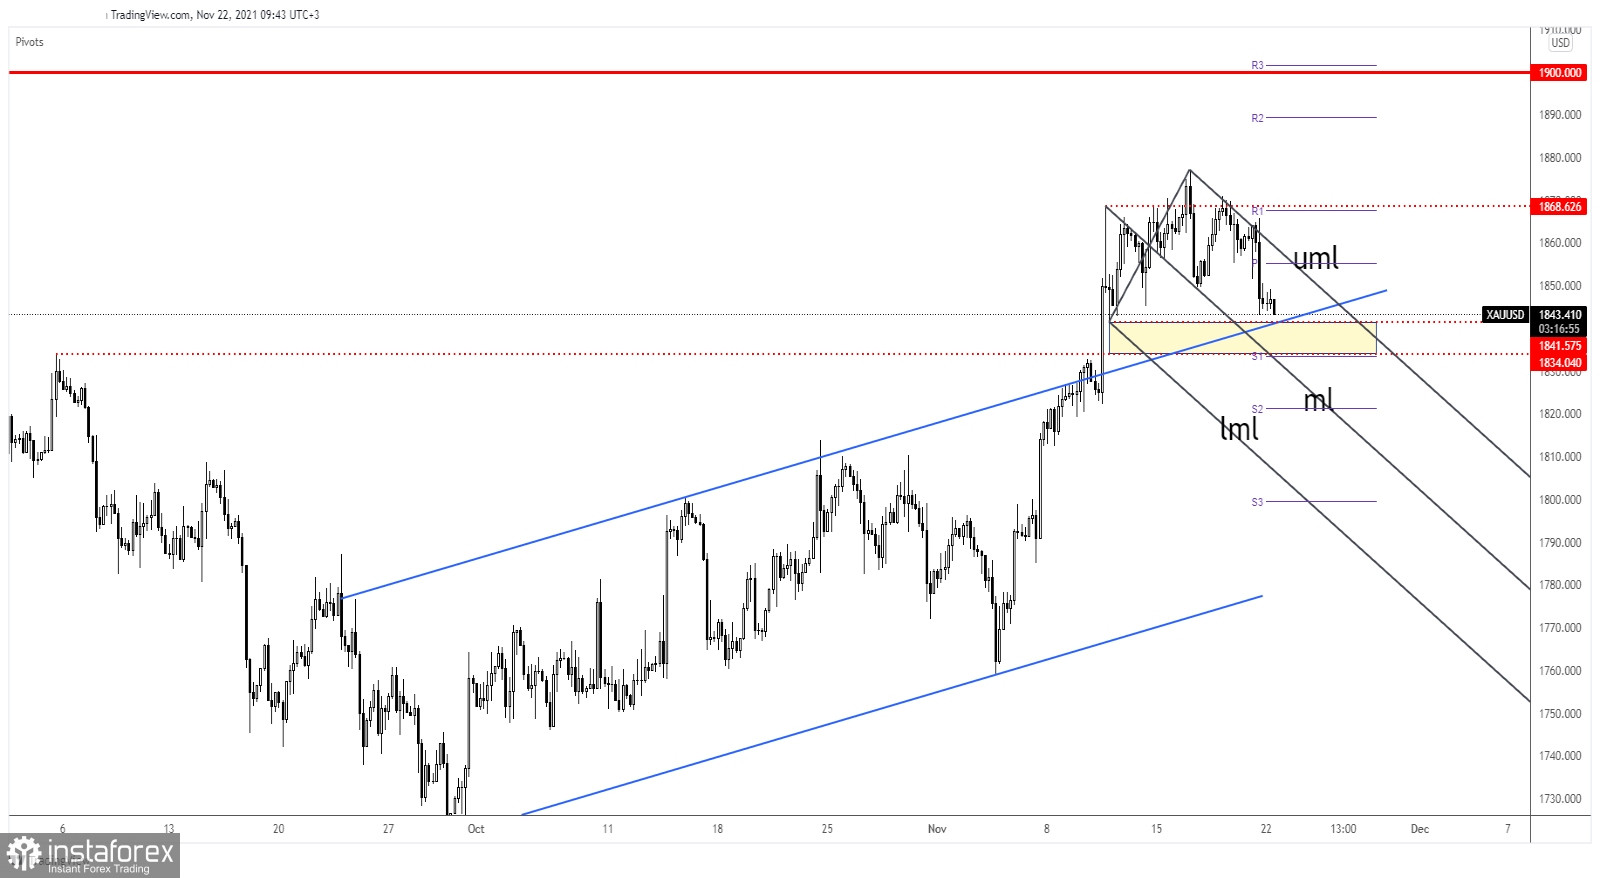
Gold reached the 1,841.57 static support and the channel's upside line. A false breakdown through this confluence area could signal that the downside movement is over and that the XAU/USD could start increasing again.
In the short term, it has dropped within the descending pitchfork's body. 1,841.57 - 1,834.04 area stands as a strong demand zone. A bullish pattern here could signal a new leg higher. Only a valid breakdown below this zone could signal and could activate a larger drop.
XAU/USD plunged after retesting 1,868.62 static resistance and now it challenges 1,841.57 static support. It's trapped within a range pattern between these levels, so only a valid breakout from this formation could bring a fresh trading opportunity and a clear direction.
A bullish pattern could signal a new upside momentum, while dropping and closing below 1,834.04 may activate a larger downside movement.
*The market analysis posted here is meant to increase your awareness, but not to give instructions to make a trade.
InstaSpot analytical reviews will make you fully aware of market trends! Being an InstaSpot client, you are provided with a large number of free services for efficient trading.


