


¡Nuestro equipo cuenta con más de 7,000,000 operadores!
Cada día, trabajamos juntos para mejorar las operaciones. Obtenemos grandes resultados y seguimos adelante.
El reconocimiento de millones de operadores en todo el mundo es el mejor agradecimiento a nuestro trabajo! ¡Usted hizo su elección y haremos todo lo que esté a nuestro alcance para satisfacer sus expectativas!
¡Juntos somos un gran equipo!
InstaSpot. ¡Orgulloso de trabajar para usted!


¡Actor, 6 veces ganador del torneo UFC y un verdadero héroe!
El hombre que se hizo a sí mismo. El hombre que sigue nuestro camino.
El secreto detrás del éxito de Taktarov es el constante movimiento hacia el objetivo.
¡Revele todo los lados de su talento!
Descubra, intente, fracase, ¡pero nunca se rinda!
InstaSpot. ¡Su historia de éxito comienza aquí!
The pressure on the cryptocurrency market remains significant. Over the past weekend, Bitcoin updated its price to $93,000 and is currently trading below $95,000, which keeps the possibility of a larger drop toward $90,000 and even $88,000 quite serious.

It is evident that, despite how attractive the current dip may seem, no one is in a hurry to buy. Meanwhile, BitMine has stated that the weakness in the crypto market may be linked to a shortfall in the balances of one or two major market makers, with large players pushing the market down by triggering liquidations.
Market participants, fearing additional bankruptcies and not wanting to be among the creditors of bad debts, prefer to stay on the sidelines, waiting for clearer signals. The absence of buyers only exacerbates the situation, provoking further price declines and new waves of liquidations. In this environment, small retail investors, frightened by volatility and potential losses, are likely to refrain from making purchases. Everyone is waiting for market stabilization or more distinct signs of recovery before risking their capital. This creates a vicious cycle: the lack of new money in the market hinders growth, while the absence of growth deters potential investors.
However, there are still those who remain committed to their strategies, and there are quite a few of them. Michael Saylor stated in an interview over the weekend that his company, Strategy, bought BTC every day last week, despite everything happening in the market. On one hand, Saylor's commitment to BTC and his unwavering belief in the long-term potential of the asset are admirable. He is viewed by many as a visionary who foresaw the explosive growth of cryptocurrency before it entered the mainstream. His position is especially notable amidst the widespread fear and panic that have engulfed the market in recent weeks. On the other hand, skeptics argue that Strategy's approach of continuous purchases appears risky and potentially unprofitable, particularly in the context of the current volatility and uncertainty in the market. Critics highlight the significant risks facing the company amid the declining BTC price and question the wisdom of further accumulating assets in such an unfavorable environment.
Trading recommendations:
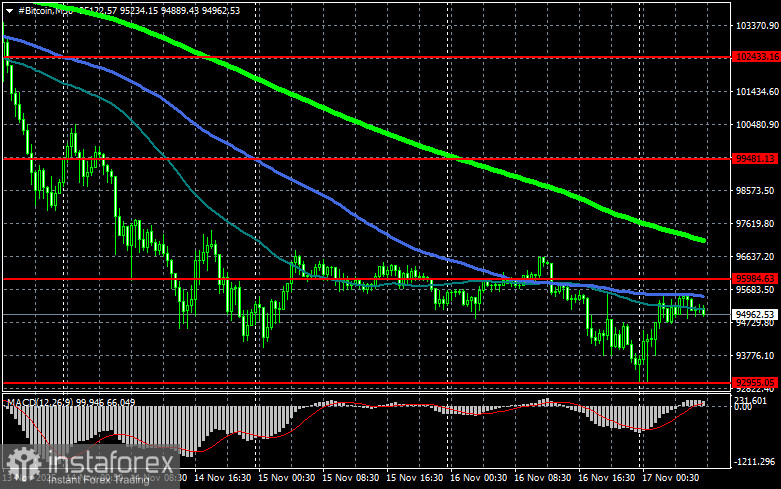
Regarding the technical picture for Bitcoin, buyers are currently targeting a return to the $95,900 level, which opens a direct path to $99,400. From there, it is a short step to $102,500. The furthest target is around $105,400. Surpassing this level would indicate attempts at a return to a bull market. In the event of a decline, buyers are expected at the $92,900 level. A drop below this area could quickly push BTC down to around $89,200, with the most distant target at $86,500.
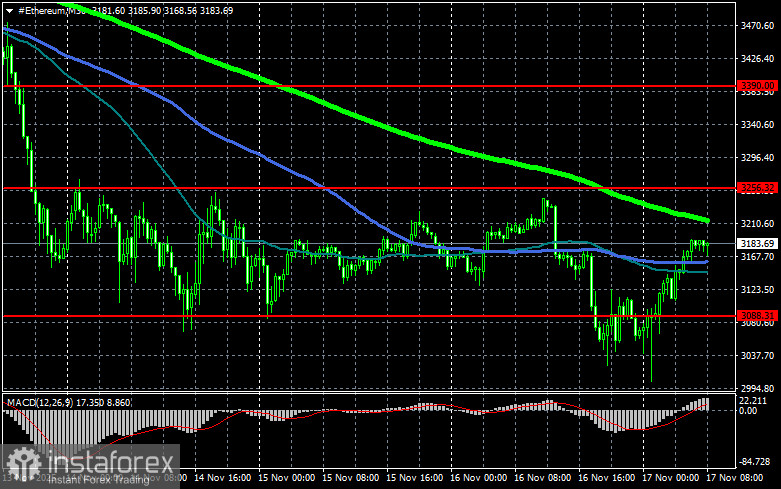
For Ethereum, clear consolidation above the $3,256 level opens the path to $3,390. The furthest objective is around $3,529. Breaking above this level would signify a strengthening bull market and increased buyer interest. If Ethereum declines, buyers are expected at the $3,088 level. A move below this area could swiftly bring ETH down to around $2,920, with the most distant support at $2,756.
What we see on the chart:
- Red lines indicate support and resistance levels where either a price slowdown or active growth is expected;
- Green lines indicate the 50-day moving average;
- Blue lines indicate the 100-day moving average;
- Light green lines indicate the 200-day moving average.
Typically, a crossover or price test of these moving averages either halts market momentum or sets a new directional impulse.
*El análisis de mercado publicado aquí tiene la finalidad de incrementar su conocimiento, más no darle instrucciones para realizar una operación.
¡Los informes analíticos de InstaSpot lo mantendrá bien informado de las tendencias del mercado! Al ser un cliente de InstaSpot, se le proporciona una gran cantidad de servicios gratuitos para una operación eficiente.


