


A lenda da equipe InstaSpot!
Lenda! Você acha que isso é retórica bombástica? Mas como devemos chamar um homem que se tornou o primeiro asiático a vencer o campeonato mundial de xadrez aos 18 anos e que se tornou o primeiro grande mestre indiano aos 19? Esse foi o começo de um caminho difícil para o título de campeão do mundo para Viswanathan Anand, o homem que se tornou parte da história do xadrez para sempre. Agora mais uma lenda na equipe InstaSpot!


O Borussia é um dos clubes de futebol com mais títulos da Alemanha, que provou repetidamente aos fãs: o espírito de competição e liderança certamente levará ao sucesso. Negocie da mesma maneira que os profissionais do esporte jogam: com confiança e ativamente. Mantenha o "ritmo" do Borussia FC e esteja na liderança com a InstaSpot!
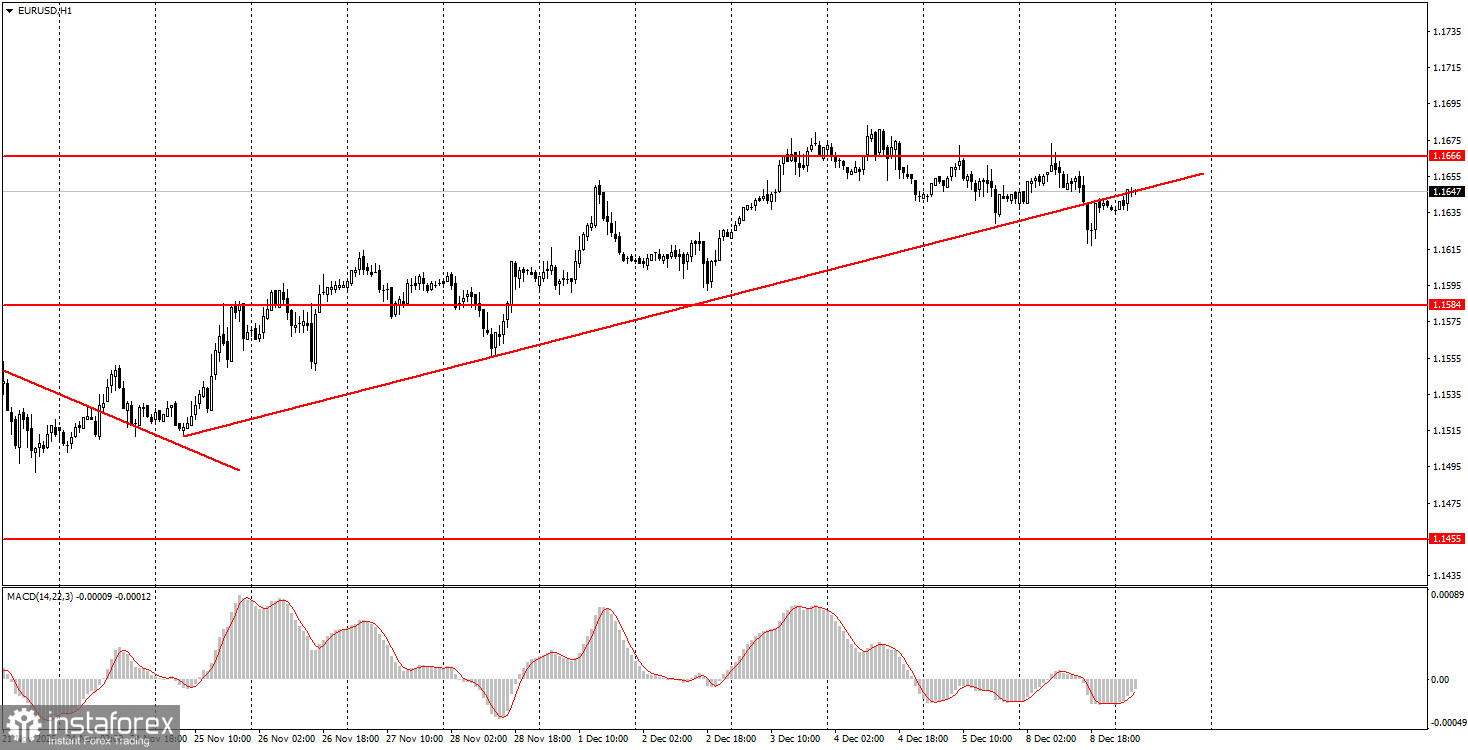
On Monday, the EUR/USD currency pair continued to correct within the upward trend. However, at this point, it is not easy to assert that the upward trend remains intact. The price established itself below the ascending trend line yesterday, so formally, the trend has changed to bearish. Nevertheless, we would like to draw the attention of novice traders to one important fact. Market movements remain very weak, so there may be situations where the breach of the trend line occurs not due to a trend reversal but rather due to the prolonged correction and the weakness of the primary movement. Recall that there will be a Federal Reserve meeting this week, and the likelihood of a further decline for the dollar is quite high. Also, on Monday, a report on German industrial production was published. Although this report is not the most significant, it showed a positive outcome above the forecast. The market could have at least slightly raised the EUR/USD pair for form's sake. The flat on the daily timeframe persists, so there is a possibility of growth towards the 1.1800 level (the upper line of the range).
On the hourly timeframe, the EUR/USD pair continues to form an upward trend, even though the price has breached the trend line. The overall fundamental and macroeconomic backdrop for the U.S. dollar remains very weak, and thus, we expect further growth. Even technical factors currently support the euro, as the flat on the daily timeframe persists, and after a reversal near the lower boundary, it is reasonable to expect growth towards the upper boundary.
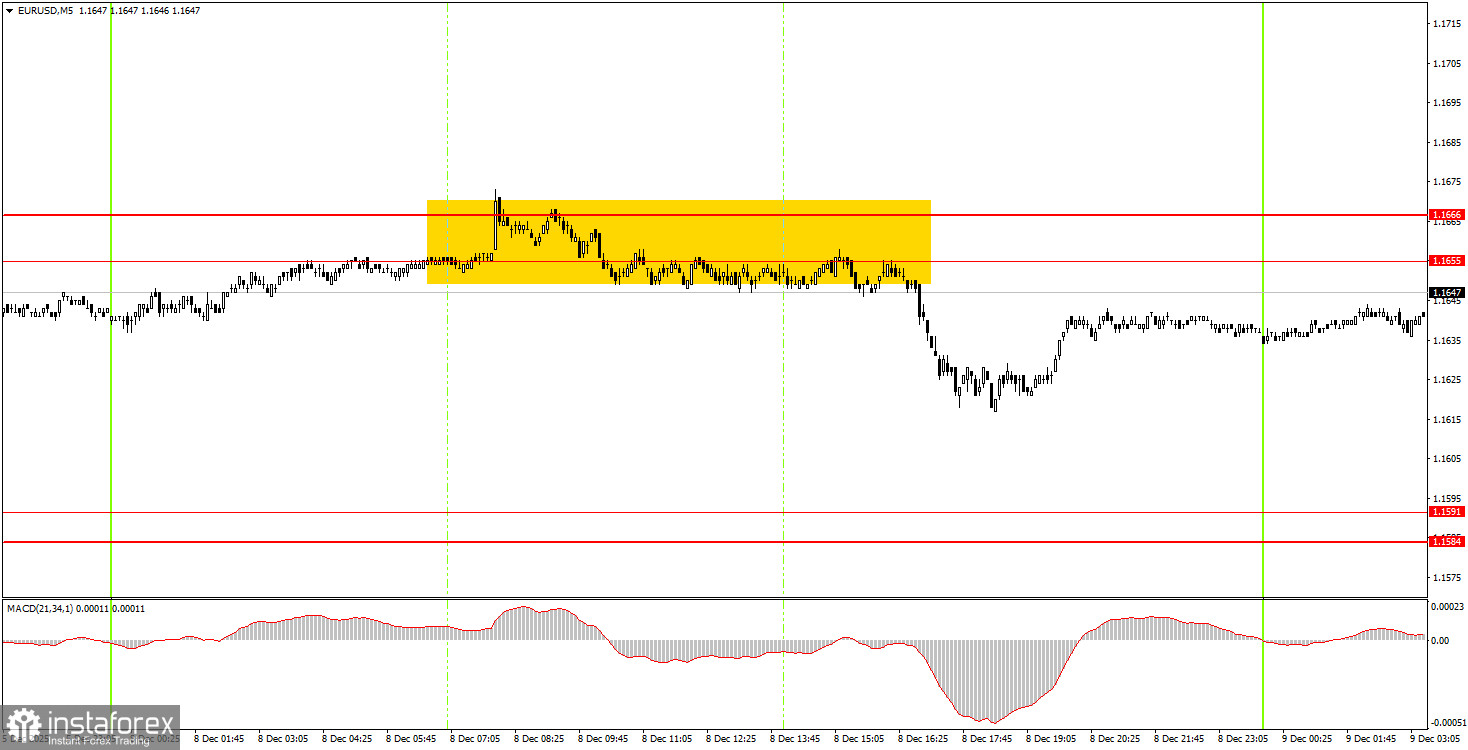
On Tuesday, beginner traders may once again trade in the 1.1655-1.1666 range, as there are no other viable options. A price rebound from this area would again allow for short positions with targets at 1.1584-1.1591. If the price settles above this area, long positions may be initiated with a target at 1.1745.
On the 5-minute timeframe, levels to consider include 1.1354-1.1363, 1.1413, 1.1455-1.1474, 1.1527-1.1531, 1.1550, 1.1584-1.1591, 1.1655-1.1666, 1.1745-1.1754, 1.1808, 1.1851, 1.1908, and 1.1970-1.1988. On Tuesday, no significant events or reports are scheduled in the Eurozone, while the U.S. will release relatively important reports on JOLTs and the number of job openings, as well as the weekly ADP report on changes in private sector employment. These data may provoke a market reaction.
Important Note: Significant speeches and reports (always included in the news calendar) can greatly influence the movement of the currency pair. Therefore, during their release, it is advisable to trade cautiously or exit the market to avoid sharp reversals against the preceding movement.
Remember: For beginners trading in the Forex market, it is important to understand that not every trade can be profitable. Developing a clear strategy and practicing money management are keys to long-term trading success.
*A análise de mercado aqui postada destina-se a aumentar o seu conhecimento, mas não dar instruções para fazer uma negociação.
InstaSpot analytical reviews will make you fully aware of market trends! Being an InstaSpot client, you are provided with a large number of free services for efficient trading.


