


The legend in the InstaSpot team!
Legend! You think that's bombastic rhetoric? But how should we call a man, who became the first Asian to win the junior world chess championship at 18 and who became the first Indian Grandmaster at 19? That was the start of a hard path to the World Champion title for Viswanathan Anand, the man who became a part of history of chess forever. Now one more legend in the InstaSpot team!


Borussia is one of the most titled football clubs in Germany, which has repeatedly proved to fans: the spirit of competition and leadership will certainly lead to success. Trade in the same way that sports professionals play the game: confidently and actively. Keep a "pass" from Borussia FC and be in the lead with InstaSpot!

The EUR/USD currency pair corrected throughout Monday. It cannot be said that the correction was strong or even noticeable—during the day, the European currency managed to recover about 30 pips after a 120-pip drop on Friday. Thus, the market is still oriented towards buying the American currency for a number of local reasons. First, the latest set of reports from overseas was impressive. Second, the "hawkish" expectations regarding the Federal Reserve's monetary policy are rising. Third, the geopolitical conflict in the Middle East is not ending, despite Donald Trump's promises. Of course, the dollar will not rise every day, but on average, it may continue to enjoy moderate demand. On Monday, there were no significant events in either the U.S. or the Eurozone, so traders had nothing to react to throughout the day. Trump again stated that a deal with Iran could be signed soon, but the market no longer believes the U.S. president.
In technical terms, the downward trend has resumed, but whether it will continue is a big question. If Tehran and Washington somehow sign a deal, demand for the U.S. currency will fall. If inflation in the U.S. starts to slow, there will be no dilemma for the Fed about whether to tighten monetary policy, which would also weaken the position of the U.S. dollar. The next inflation report is coming out on Wednesday.
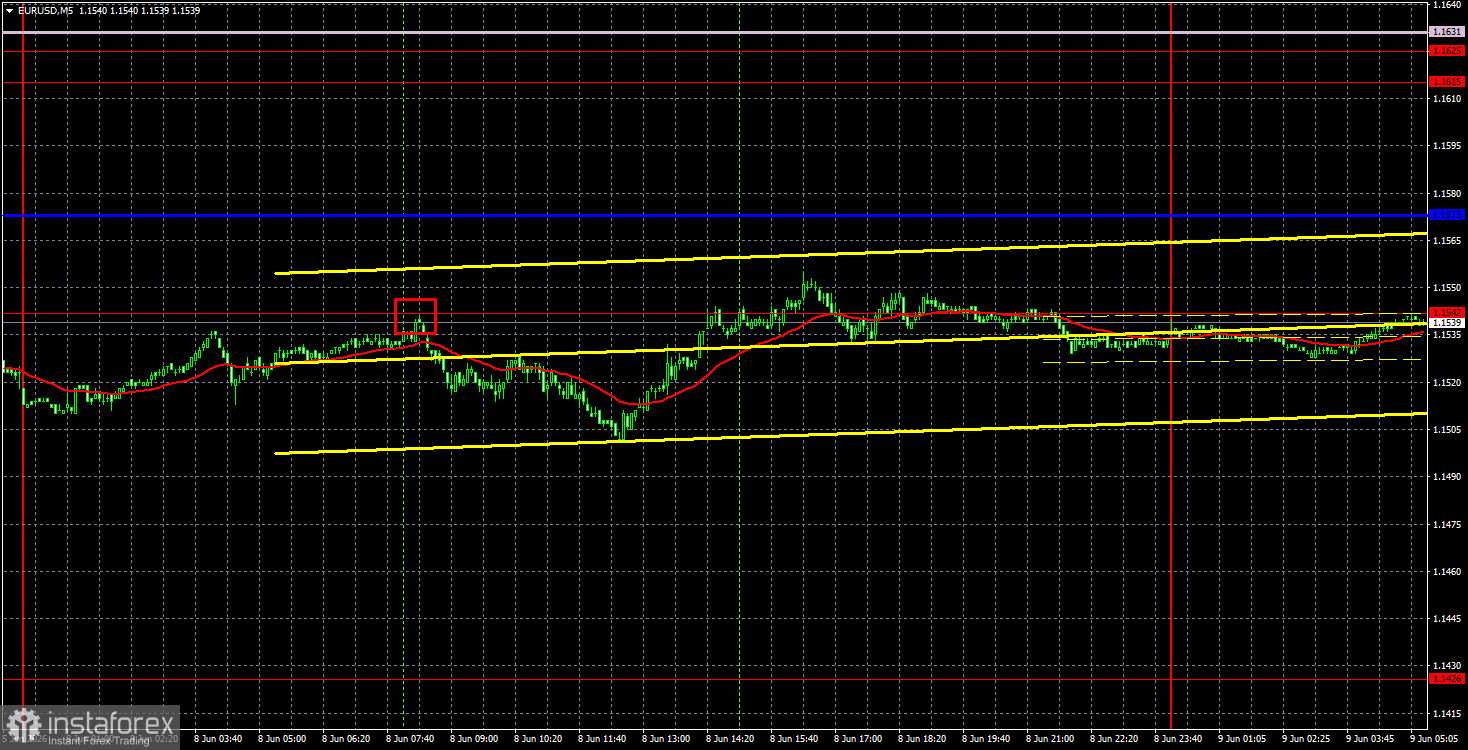
On the 5-minute timeframe, only one trading signal was formed on Monday that traders could work with. At the opening of the European trading session, the price bounced off 1.1542 and then fell by around 25-30 pips. It then returned to 1.1542 and traded around it for the rest of the day.
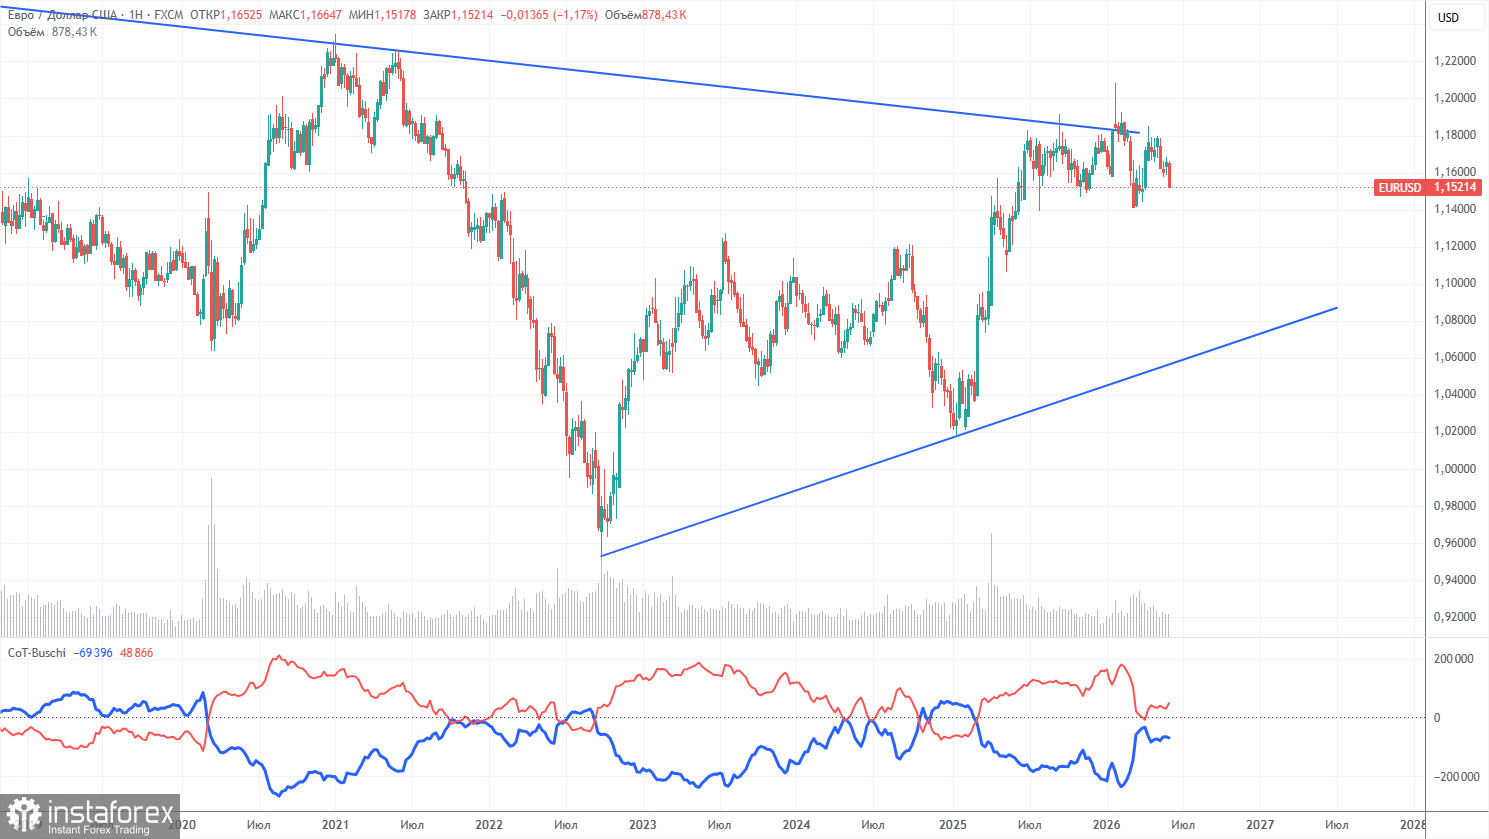
The latest COT report is dated June 2. In the weekly timeframe illustration, it is clear that the net position of non-commercial traders remains "bullish" but has declined significantly due to geopolitical events. Traders have been shedding the European currency in favor of the U.S. dollar in recent months. Trump's policies have not changed, but the dollar has served as a "reserve currency" for some time. However, this process may have already concluded.
We still do not see any fundamental factors to strengthen the European currency, while there remain sufficient factors for the U.S. dollar to decline. The war in the Middle East made the dollar temporarily super attractive, but when this factor runs out of "shelf life," everything will revert to the way it was. And that shelf life may have already expired. In the long term, the euro could fall to the level of $1.08 (the trend line), but the upward trend will still remain relevant. Over the past few months, the pair hasn't come very close to this line.
The positioning of the indicator's red and blue lines indicates parity between bulls and bears. Over the last reporting week, the number of longs in the "Non-commercial" group increased by 12,400, while the number of shorts decreased by 7,000. Consequently, the net position increased by 21,400 contracts in a week.
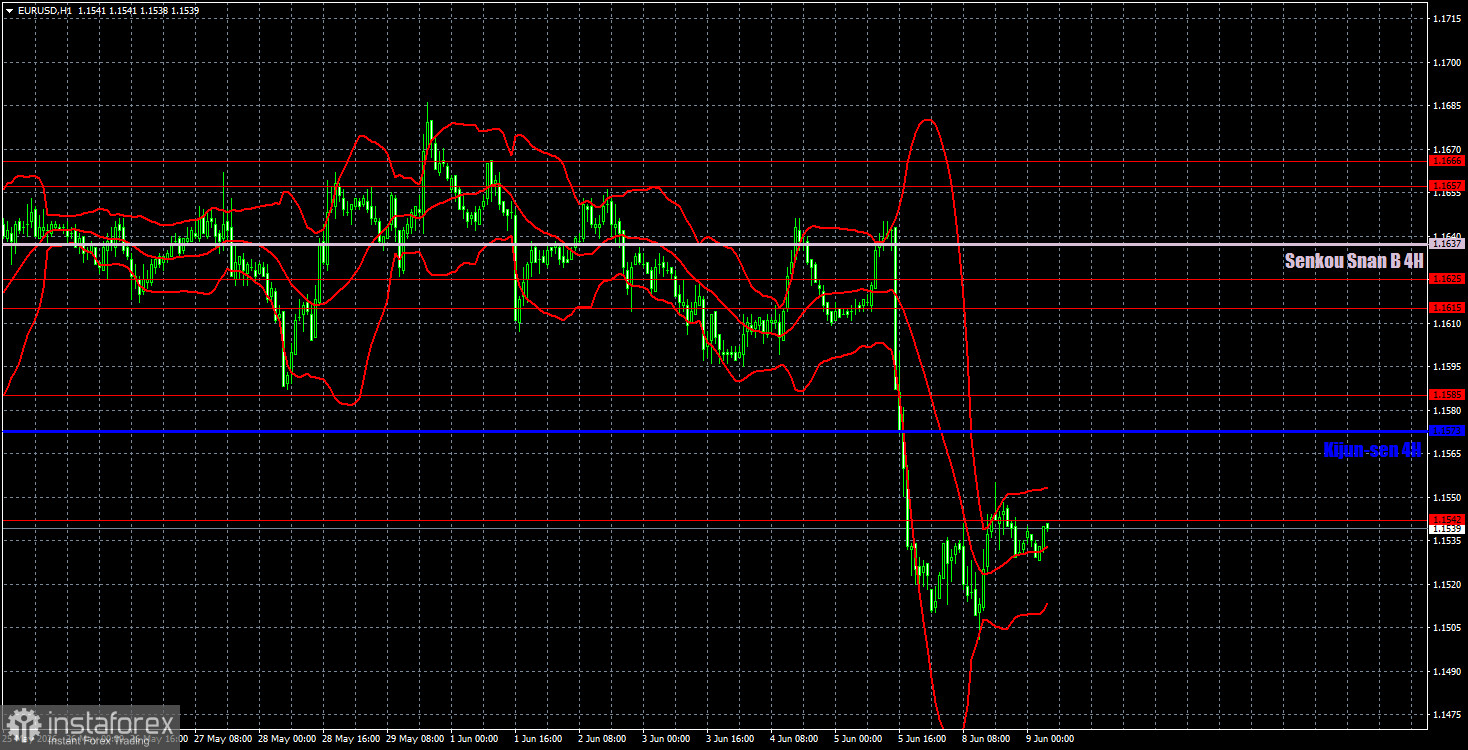
On the hourly timeframe, the EUR/USD pair has resumed its downward trend. The situation in the Middle East remains tense; it is not getting worse, but Washington and Tehran cannot agree on at least a temporary peace deal. If there are no new signs of a resumption of war in the Middle East and a memorandum of understanding is signed, the dollar will begin to lose ground. But so far, we see neither a deal nor a resurgence of war.
On June 9, we highlight the following levels for trading: 1.1362, 1.1426, 1.1542, 1.1585, 1.1615-1.1625, 1.1657-1.1666, 1.1750-1.1760, 1.1786, 1.1830-1.1837, 1.1907-1.1922, as well as the Senkou Span B line (1.1637) and Kijun-sen (1.1573). The Ichimoku indicator lines may shift during the day, which should be considered when determining trading signals. Don't forget to set a Stop Loss order to break even once the price moves in the correct direction by 15 pips. This will safeguard against potential losses if the signal proves false.
On Tuesday, only secondary reports will be released in the Eurozone and the U.S. For example, Germany will release reports on the trade balance and industrial production, while the U.S. will report on weekly ADP employment and home sales. We do not expect the market to react to any of these reports.
Today, traders may consider short positions targeting 1.1444 if the price remains below 1.1542. Long positions can be opened if the price consolidates above 1.1542, with a target of 1.1585.
Support and resistance price levels (resistance/support) are indicated by thick red lines, around which movement may end. They are not sources of trading signals.
Kijun-sen and Senkou Span B lines are Ichimoku indicator lines transferred to the hourly timeframe from the 4-hour timeframe. They are strong lines.
Extremum levels are indicated by thin red lines from which the price has previously bounced. They are sources of trading signals.
Yellow lines indicate trend lines, trending channels, and any other technical patterns.
Indicator 1 on the COT charts shows the size of net positions for each category of traders.
*The market analysis posted here is meant to increase your awareness, but not to give instructions to make a trade.
InstaSpot analytical reviews will make you fully aware of market trends! Being an InstaSpot client, you are provided with a large number of free services for efficient trading.


