


Our team has over 7,000,000 traders!
Every day we work together to improve trading. We get high results and move forward.
Recognition by millions of traders all over the world is the best appreciation of our work! You made your choice and we will do everything it takes to meet your expectations!
We are a great team together!
InstaSpot. Proud to work for you!


Actor, UFC 6 tournament champion and a true hero!
The man who made himself. The man that goes our way.
The secret behind Taktarov's success is constant movement towards the goal.
Reveal all the sides of your talent!
Discover, try, fail - but never stop!
InstaSpot. Your success story starts here!

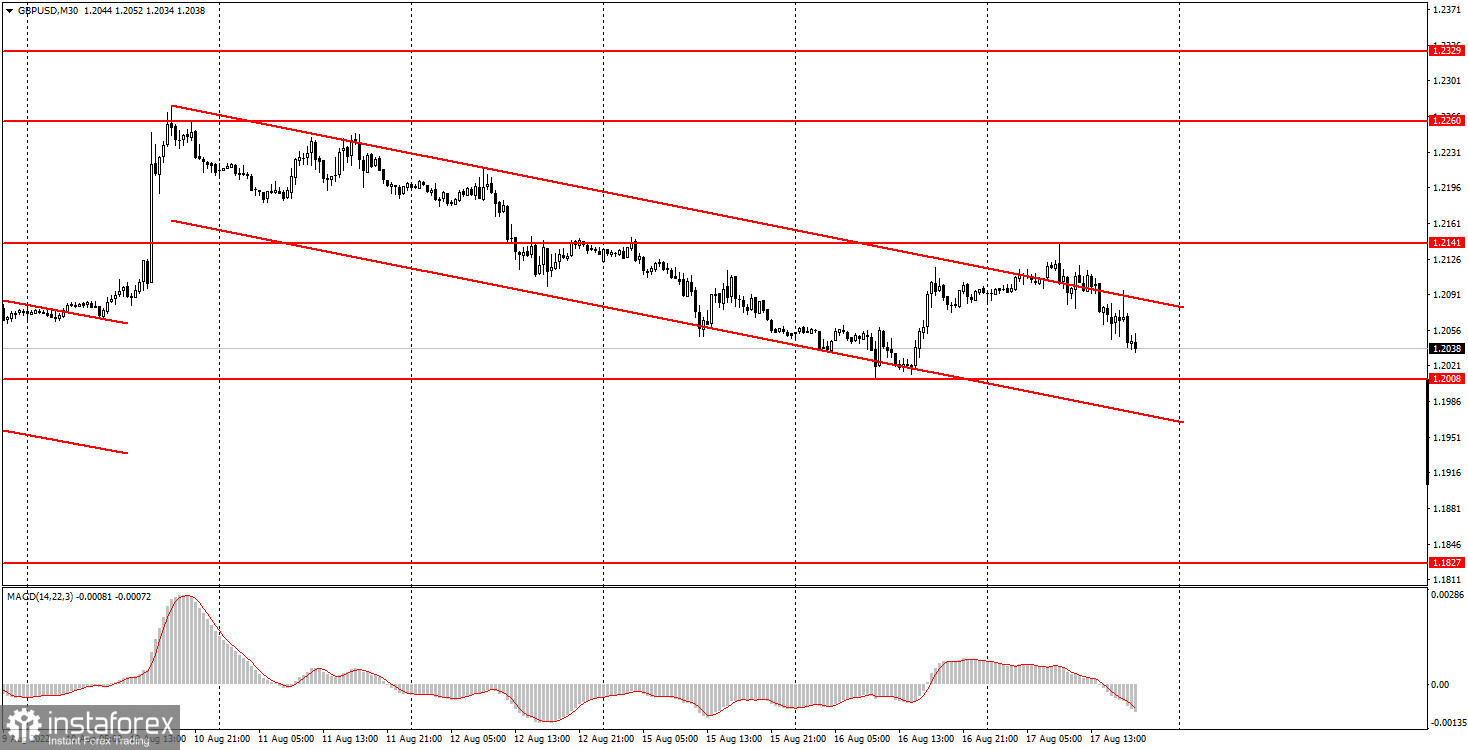
The GBP/USD pair also traded very strangely on Wednesday, but at the same time understandable. Let's take a detailed look at all the pair's movements during the day. At night, the quotes of the British currency went up. We warned that the current descending channel is very narrow, so the pair can exit it at any time. That is exactly what happened at night. However, as soon as the British inflation report was published in July, the pair immediately turned down and resumed the downward movement, in which it was for most of the day. Therefore, the first conclusion is that today it was macroeconomics that influenced the mood of the market and turned it down. Further, the inflation report showed another acceleration. This time up to 10.1%. This increase in the consumer price index is not surprising, as British inflation has never given any reason to believe that it is going to slow down. Despite six rate hikes by the Bank of England. Traders worked out this report by selling the British currency, so conclusion number two: the market no longer believes that the BoE will continue to raise the rate aggressively and do everything to suppress inflation. Or it does not believe that the central bank will be able to complete this task in the near future. This moment works in favor of the US dollar, as the Federal Reserve is going to continue to raise its rate, and the market has no reason to worry about the decline in inflation in America. It was already starting to slow down.
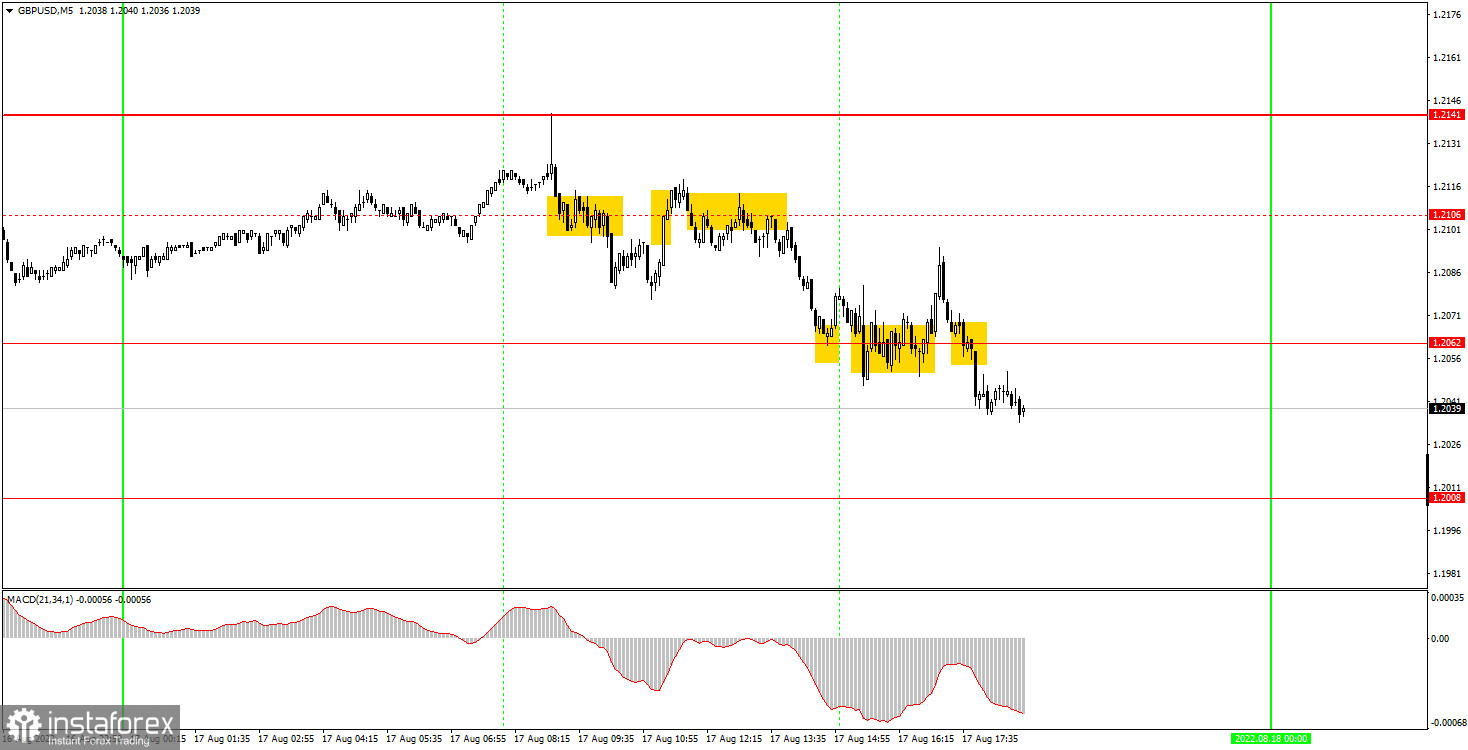
The pound/dollar pair moved very poorly on the 5-minute timeframe on Wednesday. Despite the fact that the movement looks quite trendy on the 30-minute timeframe, we see frequent pullbacks and corrections on the 5-minute timeframe, which greatly interfered with trading. We removed the 1.2106 level at the end of the day, and added the 1.2141 level. The first three trading signals formed near the level of 1.2106 and the first two turned out to be false. That is, exactly those that traders could work out. However, the first signal was generated literally 10 minutes after the release of the inflation report, so it could be ignored. The second was blatantly false, and the third, it turns out, the beginners could work out, and it made it possible to earn about 20 points of profit, which went to cover the loss on the first transaction. The signal to buy near the level of 1.2062 (both the first and the second ones) also had to be filtered, since it was at this time that the retail sales report was published in America. We said that we do not expect a strong reaction from the market, but still at that time the pair was tossed from side to side, so it was better not to enter the market. The last sell signal near the level of 1.2062 was formed quite late, but was profitable. Even if it is not taken into account, then today could have ended in zero.
The pound/dollar pair has formed a clear downward trend on the 30-minute time frame, which has already been broken. So far, we will not take into account the exit outside the downward channel, since it took place during the release of an important report. Let's assume it didn't exist. The pound may continue to fall, but it is required to overcome the level of 1.2008. On the 5-minute TF on Thursday, it is recommended to trade at the levels of 1.1898, 1.1967, 1.2008, 1.2062, 1.2141, 1.2186-1.2205, 1.2245-1.2260. When the price passes after opening a deal in the right direction for 20 points, Stop Loss should be set to breakeven. No major events scheduled for Thursday in the UK and the US, so traders will have nothing to react to during the day.
1) The signal strength is calculated by the time it took to form the signal (bounce or overcome the level). The less time it took, the stronger the signal.
2) If two or more deals were opened near a certain level based on false signals (which did not trigger Take Profit or the nearest target level), then all subsequent signals from this level should be ignored.
3) In a flat, any pair can form a lot of false signals or not form them at all. But in any case, at the first signs of a flat, it is better to stop trading.
4) Trade deals are opened in the time period between the beginning of the European session and until the middle of the US one, when all deals must be closed manually.
5) On the 30-minute TF, using signals from the MACD indicator, you can trade only if there is good volatility and a trend, which is confirmed by a trend line or a trend channel.
6) If two levels are located too close to each other (from 5 to 15 points), then they should be considered as an area of support or resistance.
Support and Resistance Levels are the Levels that serve as targets when buying or selling the pair. You can place Take Profit near these levels.
Red lines are the channels or trend lines that display the current trend and show in which direction it is better to trade now.
The MACD indicator (14,22,3) consists of a histogram and a signal line. When they cross, this is a signal to enter the market. It is recommended to use this indicator in combination with trend lines (channels and trend lines).
Important speeches and reports (always contained in the news calendar) can greatly influence the movement of a currency pair. Therefore, during their exit, it is recommended to trade as carefully as possible or exit the market in order to avoid a sharp price reversal against the previous movement.
Beginners on Forex should remember that not every single trade has to be profitable. The development of a clear strategy and money management are the key to success in trading over a long period of time.
*The market analysis posted here is meant to increase your awareness, but not to give instructions to make a trade.
InstaSpot analytical reviews will make you fully aware of market trends! Being an InstaSpot client, you are provided with a large number of free services for efficient trading.


