


Náš tým má více než 7 000 000 obchodníků!
Každý den spolupracujeme na zlepšení obchodování. Realizujeme pro vás vysoké zisky a jdeme dále.
Uznání miliony obchodníků po celém světě je nejlepší ocenění naší práce! Vybrali jste si a my uděláme vše, co je potřeba, abychom splnili vaše očekávání!
Jsme spolu skvělý tým!
InstaSpot. Hrdě pracujeme pro vás!


Herec, šampion turnaje UFC 6 a opravdový hrdina!
Muž, který vyhrává. Muž, který jde po cestě
Tajemství úspěchu Taktarova je neustálý pohyb směrem k cíli.
Zjistěte všechny výhody vašeho talentu!
Objevovat, zkoušet i prohrávat - ale nevzdávat se!
InstaSpot. Váš příběh o úspěchu začíná zde!

The GBP/USD currency pair also made a slight correction throughout Monday, but traders did not see any significant movements. As we warned, the day turned out dull and uninteresting due to a lack of macroeconomic or fundamental events. The market is now paying only a very indirect attention to geopolitical news. No one in the market is currently interested in Trump's latest promises of a deal with Iran, which are accompanied by rocket strikes in the Middle East. Thus, the market is waiting for new significant events that can help answer the questions "How will the Fed act in 2026?" and "Are there real signs of an end to the war in the Middle East?" The next event that may provide answers to one of these questions is the U.S. inflation report, which will be released tomorrow. If inflation continues to accelerate, the chances of the Federal Reserve tightening policy in 2026 will increase, thereby supporting the U.S. dollar.
From a technical standpoint, the downward trend continues. The price is below the Ichimoku indicator lines, but there is currently no trend line, and the dollar's rise on Friday might be a one-off occurrence. Geopolitics no longer supports the dollar as it did before, but in 2026, many factors are favoring the American currency. Significant reasons are needed for a new price drop.
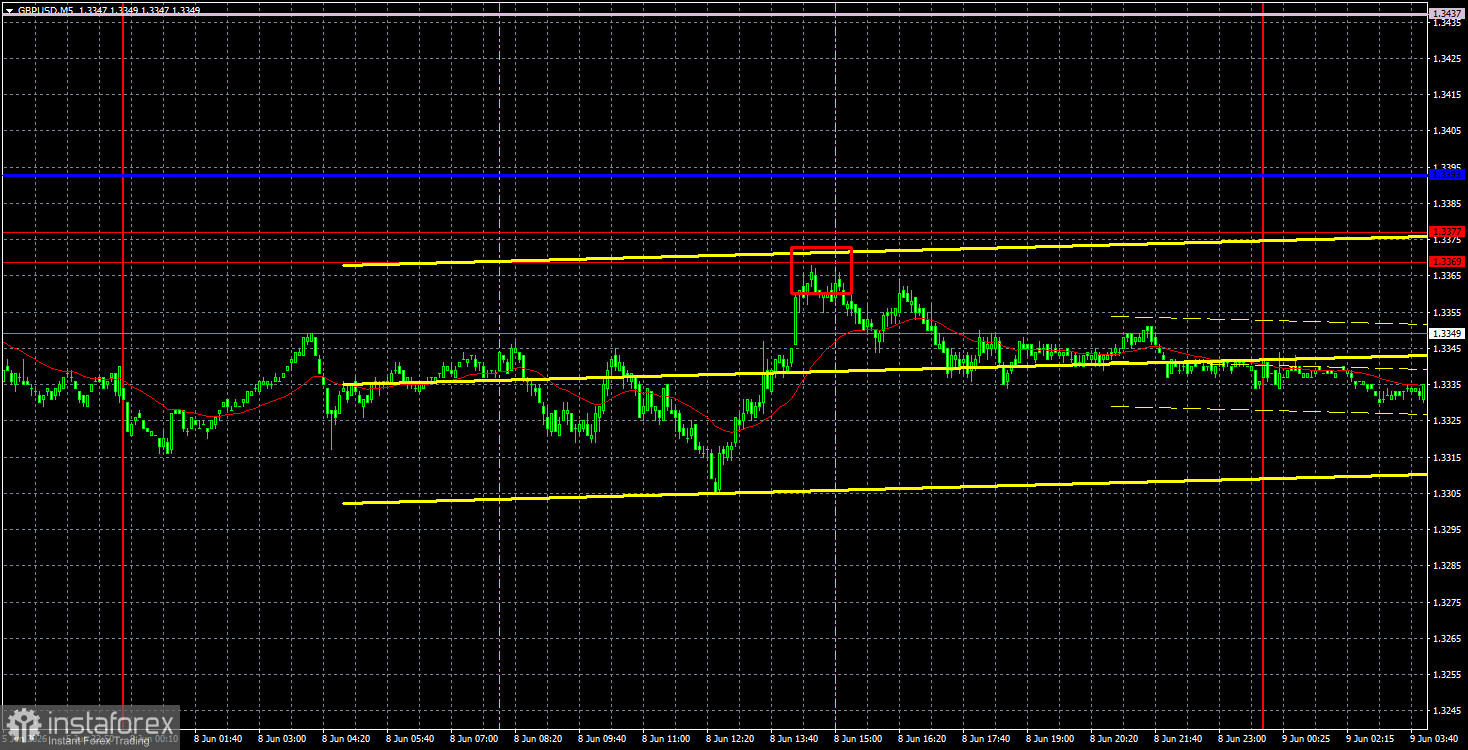
On the 5-minute timeframe on Monday, a fairly decent sell trading signal was formed. At the beginning of the American trading session, the price bounced off with minimal deviation from the 1.3369-1.3377 area and moved down by about 10-15 pips by the end of the day. Volatility was again low.
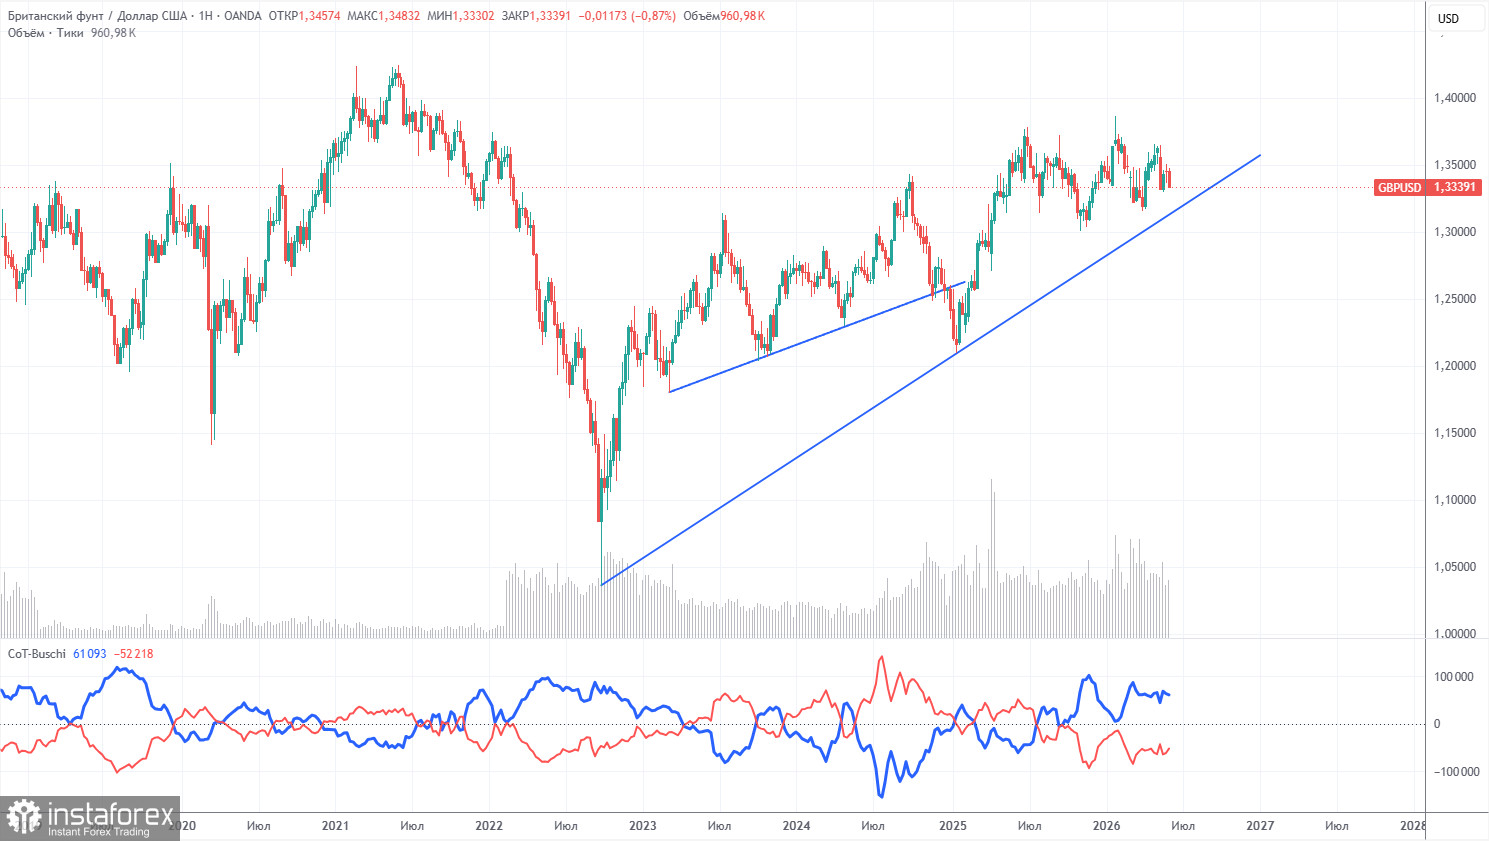
The COT reports for the British pound show that commercial traders' sentiment has been constantly changing in recent years. The red and blue lines, representing the net positions of commercial and non-commercial traders, frequently cross each other and are mostly close to zero. Right now, the lines are moving apart, with non-commercial traders still dominating in terms of sales. Given the events in the Middle East, it is not surprising that demand for risk currencies is low.
In the long term, the dollar continues to decline due to Trump's policies, which are clearly visible on the weekly timeframe (illustration above). The trade war will continue in one form or another for a long time, and Trump's policies are aimed, directly and indirectly, at weakening the U.S. currency. However, geopolitical factors are currently at the forefront, which have recently provided strong support to the dollar. Since the conflict in the Middle East cannot be considered resolved, the U.S. dollar may show growth in the future. According to the latest COT report (dated June 2), the "Non-commercial" group closed 4,300 BUY contracts and 13,500 SELL contracts. Thus, the net position of non-commercial traders increased by 9,200 contracts over the week.
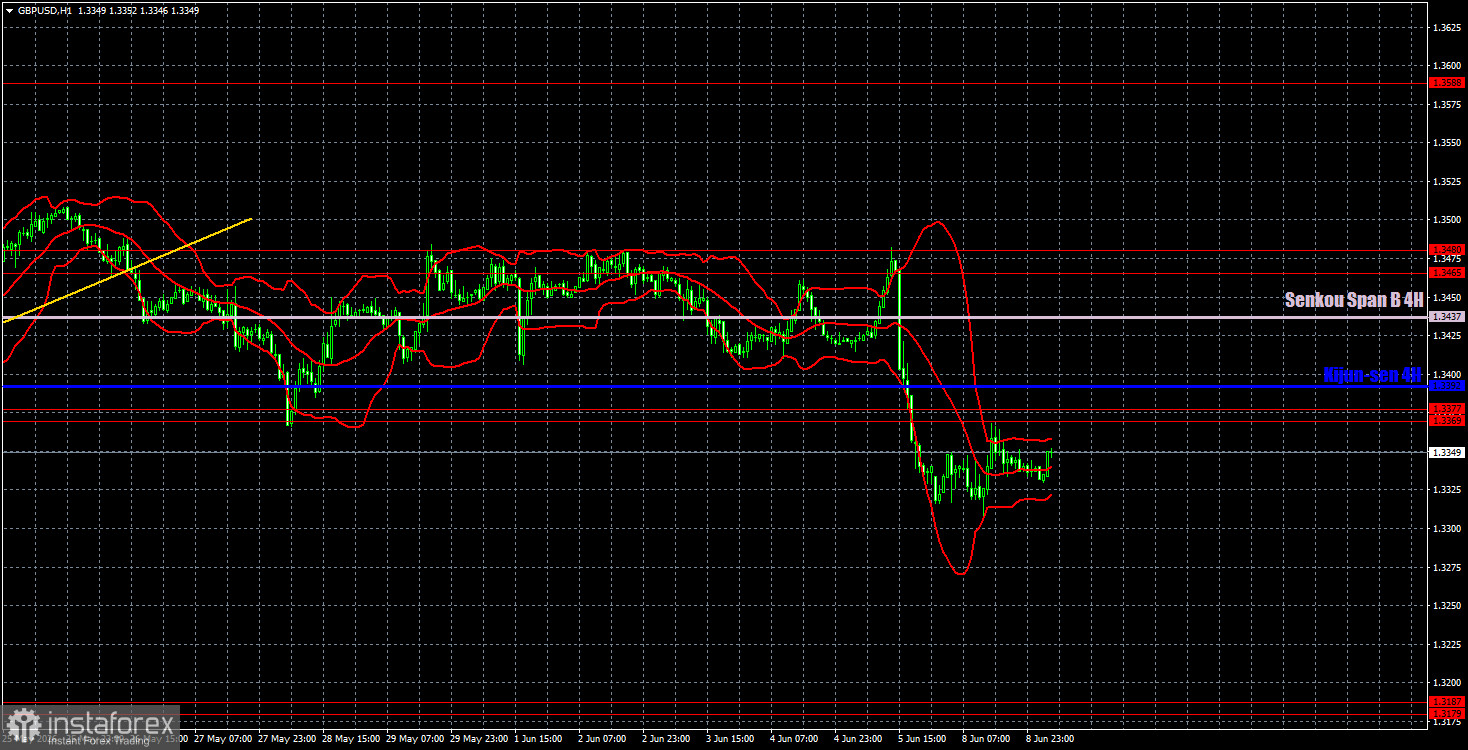
On the hourly timeframe, the GBP/USD pair has ended its upward trend amid the latest tensions surrounding the Strait of Hormuz and relations between Iran and the U.S. The macroeconomic and fundamental background still does not significantly influence the pair's movements (with rare exceptions). We do not believe that, without a real escalation of the conflict in the Middle East, the dollar can show strong growth, but the U.S. currency's position is currently more favorable than that of the British pound.
For June 9, we highlight the following important levels: 1.3096-1.3115, 1.3179-1.3187, 1.3369-1.3377, 1.3465-1.3480, 1.3588, 1.3671-1.3681, 1.3751-1.3763. The Senkou Span B line (1.3437) and Kijun-sen (1.3392) may also serve as signal sources. It is recommended to set the Stop Loss at breakeven when the price moves 20 pips in the correct direction. The Ichimoku indicator lines may shift throughout the day, which should be considered when determining trading signals.
On Tuesday, important events and reports are not scheduled in the UK, while the U.S. will release the less interesting ADP report and existing home sales data. We do not expect the market to react to these reports, so today's volatility may again be low, and the price may remain near 1.3369-1.3377.
Today, traders may consider short positions targeting 1.3179-1.3187 if the price bounces from 1.3369-1.3377. Long positions could become relevant if consolidation above the 1.3369-1.3377 range occurs, but the Ichimoku indicator lines are in close proximity to this area, from which price may bounce.
Support and resistance price levels (resistance/support) are indicated by thick red lines, around which movement may end. They are not sources of trading signals.
Kijun-sen and Senkou Span B lines are Ichimoku indicator lines transferred to the hourly timeframe from the 4-hour timeframe. They are strong lines.
Extremum levels are indicated by thin red lines from which the price has previously bounced. They are sources of trading signals.
Yellow lines indicate trend lines, trending channels, and any other technical patterns.
Indicator 1 on the COT charts shows the size of net positions for each category of traders.
*Účelem zde zveřejněné analýzy trhu je zvýšení vašeho povědomí, nikoli dávání pokynů k obchodování.
Díky analytickým přehledům společnosti InstaSpot získáte plné povědomi o tržních trendech! Jako zákazníkovi společnosti InstaSpot je Vám k dispozici velký počet bezplatných služeb umožňujících efektivní obchodování.


