


Нашият екип има над 7 000 000 търговци!
Всеки ден работим заедно, за да подобрим търговията. Получаваме високи резултати и напредваме.
Признанието от милионите търговци по целия свят е най-доброто признание за нашата работа! Направихте своя избор и ние ще направим всичко, което е необходимо, за да отговорим на вашите очаквания!
Ние сме един страхотен екип заедно!
ИнстаФорекс. Горд съм да работя за вас!


Актьор, шампион на UFC 6 турнира и истински герой!
Човекът, който изгради себе си. Човекът, който върви по пътя ни.
Тайната зад успеха на Тактаров е постоянно движение към целта.
Открийте всички страни на вашия талант!
Откривайте, опитвайте, проваляйте се - но никога не спирайте!
ИнстаФорекс. Вашата успешна история започва тук!

Trend analysis
This week, GBP/USD may rise from 1.2747 (closing price of the last weekly candle) to the 76.4% retracement level of 1.2897 (red dashed line). Upon testing it, the pair will move further up towards the 85.4% retracement level of 1.2990 (red dashed line).
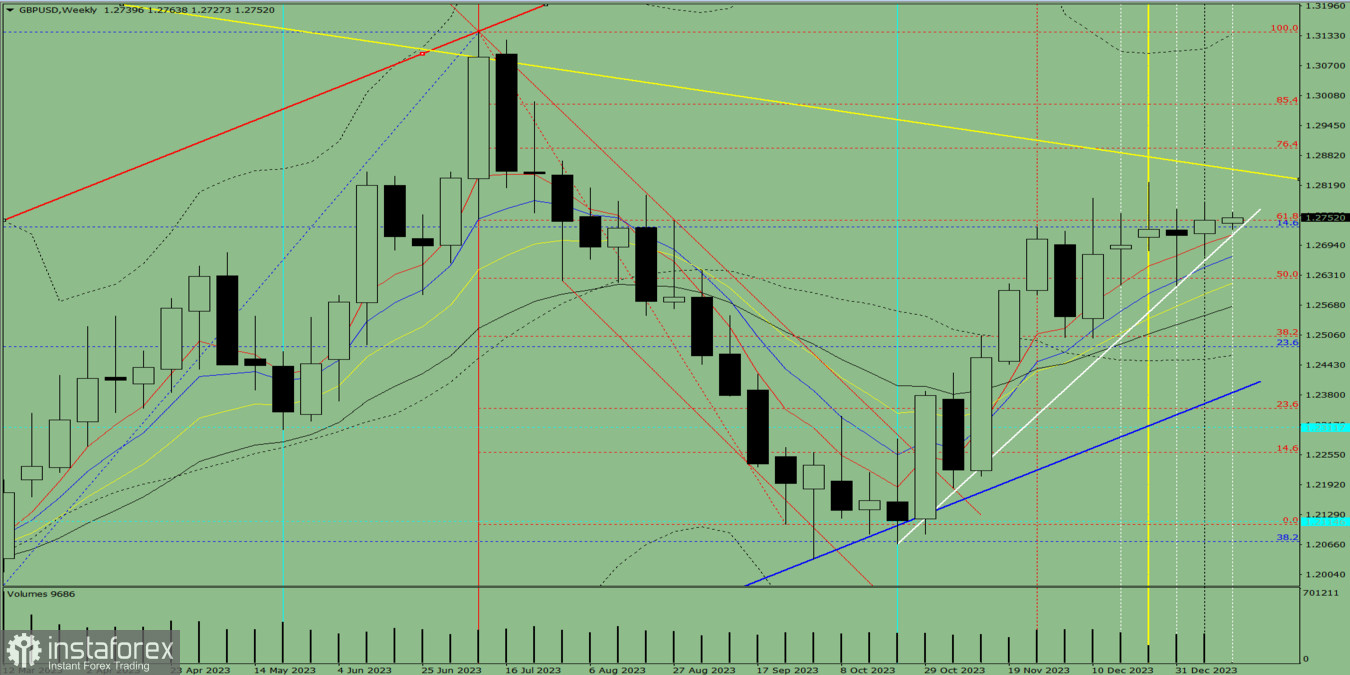
Fig. 1 (weekly chart)
Comprehensive analysis:
Indicator analysis - upward
Fibonacci levels -upward
Volumes - upward
Candlestick analysis - upward
Trend analysis - upward
Bollinger bands - upward
Monthly chart - upward
Conclusion: The indicators point to an upward movement in GBP/USD.
Overall conclusion: The pair will have a bullish trend, with a first lower shadow on the weekly white candle (Monday - upward) and a second upper shadow (Friday - downward).
So during the week, pound will climb from 1.2747 (closing price of the last weekly candle) to the resistance line at 1.2852 (yellow bold line), and then rise further to the 76.4% retracement level of 1.2897 (red dashed line).
Alternatively, it could increase from 1.2747 (closing price of the last weekly candle) to the 76.4% retracement level of 1.2897 (red dashed line), followed by a decline to the upper fractal located at 1.2826 (weekly candle from December 24, 2023).
*Анализът на пазара публикуван тук има за цел да повиши информираността Ви, но не и да дава указания за търговия.
Аналитичните прегледи на ИнстаФорекс ще ви запознаят изцяло с пазарните тенденции! Като клиент на ИнстаФорекс, на вас се предоставят голям брой безплатни услуги за ефикасна търговия.


