


Легендата в екипа на ИнстаФорекс!
Легенда! Мислите ли, че това е бомбастична реторика? Но как да наречем човек, който на 18 години стана първият азиатец спечелил световния шампионат по шах за юноши и на 19 години стана първият гросмайстор на Индия? Това беше началото на труден път към титлата на световен шампион за Вишванатан Ананд, човекът, който стана част от историята на шаха завинаги. Сега още една легенда в екипа на ИнстаФорекс!


Борусия е един от най-титулуваните футболни клубове в Германия, който многократно се е доказал пред феновете: духът на конкуренция и лидерство със сигурност ще доведе до успех. Търгувайте по същия начин, по който спортните професионалисти играят играта: уверено и активно. Запазете „пас" от ФК „Борусия" и бъдете начело с ИнстаФорекс!

Trend analysis (Fig. 1).
The GBP/USD currency pair may move downward from the level of 1.2139 (closing of yesterday's daily candle) to 1.2089, the lower fractal (daily candle from 19/10/2023). In the case of testing this level, an upward movement is possible with a target at 1.2215, the 23.6% pullback level (red dotted line).
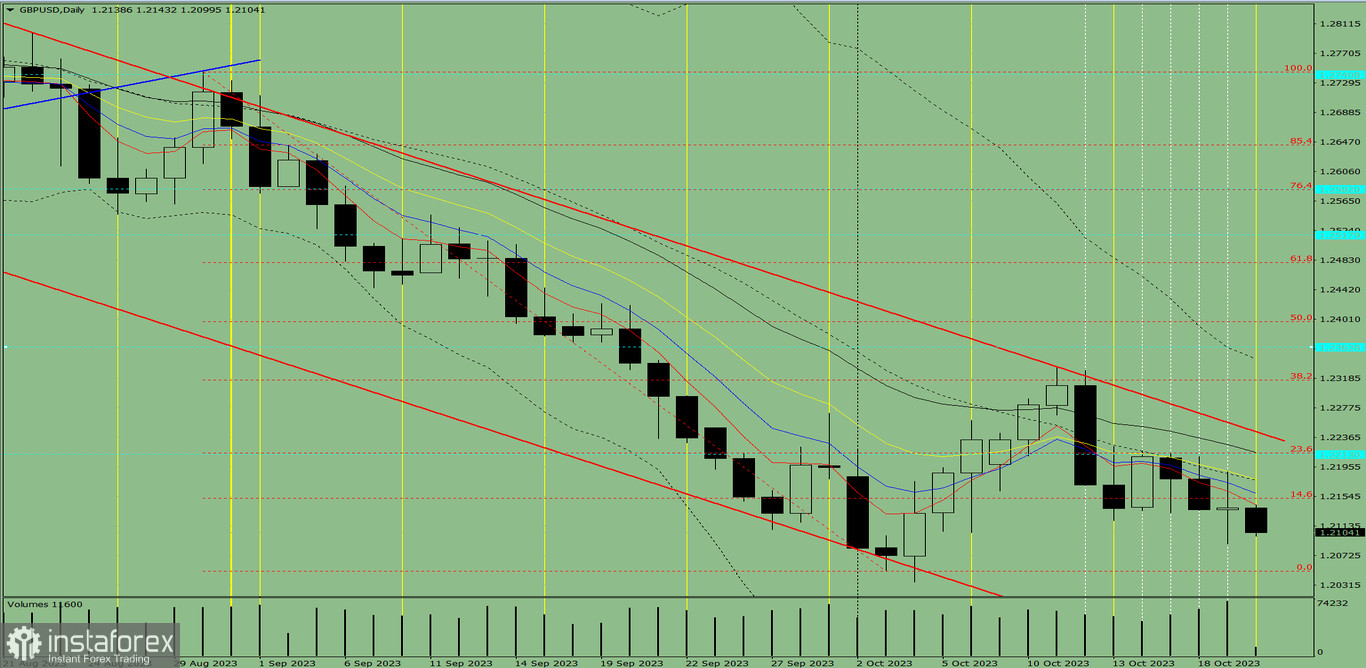
Fig. 1 (daily chart).
Comprehensive analysis:
General conclusion: Today, the price may move downward from the level of 1.2139 (closing of yesterday's daily candle) to 1.2089, the lower fractal (daily candle from 19/10/2023). In the case of testing this level, an upward movement is possible with a target at 1.2215, the 23.6% pullback level (red dotted line).
Alternatively, the price may move downward from the level of 1.2139 (closing of yesterday's daily candle) to 1.2050, the lower fractal (red dotted line). Upon reaching this level, an upward movement is possible with a target at 1.2216, the 21-period EMA (thin black line).
*Анализът на пазара публикуван тук има за цел да повиши информираността Ви, но не и да дава указания за търговия.
Аналитичните прегледи на ИнстаФорекс ще ви запознаят изцяло с пазарните тенденции! Като клиент на ИнстаФорекс, на вас се предоставят голям брой безплатни услуги за ефикасна търговия.


