


Нашият екип има над 7 000 000 търговци!
Всеки ден работим заедно, за да подобрим търговията. Получаваме високи резултати и напредваме.
Признанието от милионите търговци по целия свят е най-доброто признание за нашата работа! Направихте своя избор и ние ще направим всичко, което е необходимо, за да отговорим на вашите очаквания!
Ние сме един страхотен екип заедно!
ИнстаФорекс. Горд съм да работя за вас!


Актьор, шампион на UFC 6 турнира и истински герой!
Човекът, който изгради себе си. Човекът, който върви по пътя ни.
Тайната зад успеха на Тактаров е постоянно движение към целта.
Открийте всички страни на вашия талант!
Откривайте, опитвайте, проваляйте се - но никога не спирайте!
ИнстаФорекс. Вашата успешна история започва тук!

The euro/dollar pair showed quite a confident downward movement and managed to overcome the uptrend line on Monday. Thus, the pair will no longer rise, and it may fall to the Senkou Span B line. As a reminder, as long as the price has not crossed both Ichimoku indicator lines (unless it is flat on the higher time frame), we don't consider the trend "hopeless". In other words, the pair still has chances to restore the upward movement if it is above the Senkou Span B line. But if it falls below the Senkou Span B line, then it might rush to its 20-year lows again.
Remember that we consider the latest upward trend on the one-hour chart, to put it mildly, as groundless. Thus, the fall is logical. In fact, yesterday the US dollar rose without any reason either, as there were no important events and reports in the USA or the European Union. In any case, we are waiting for the price to fall to the Senkou Span B line.
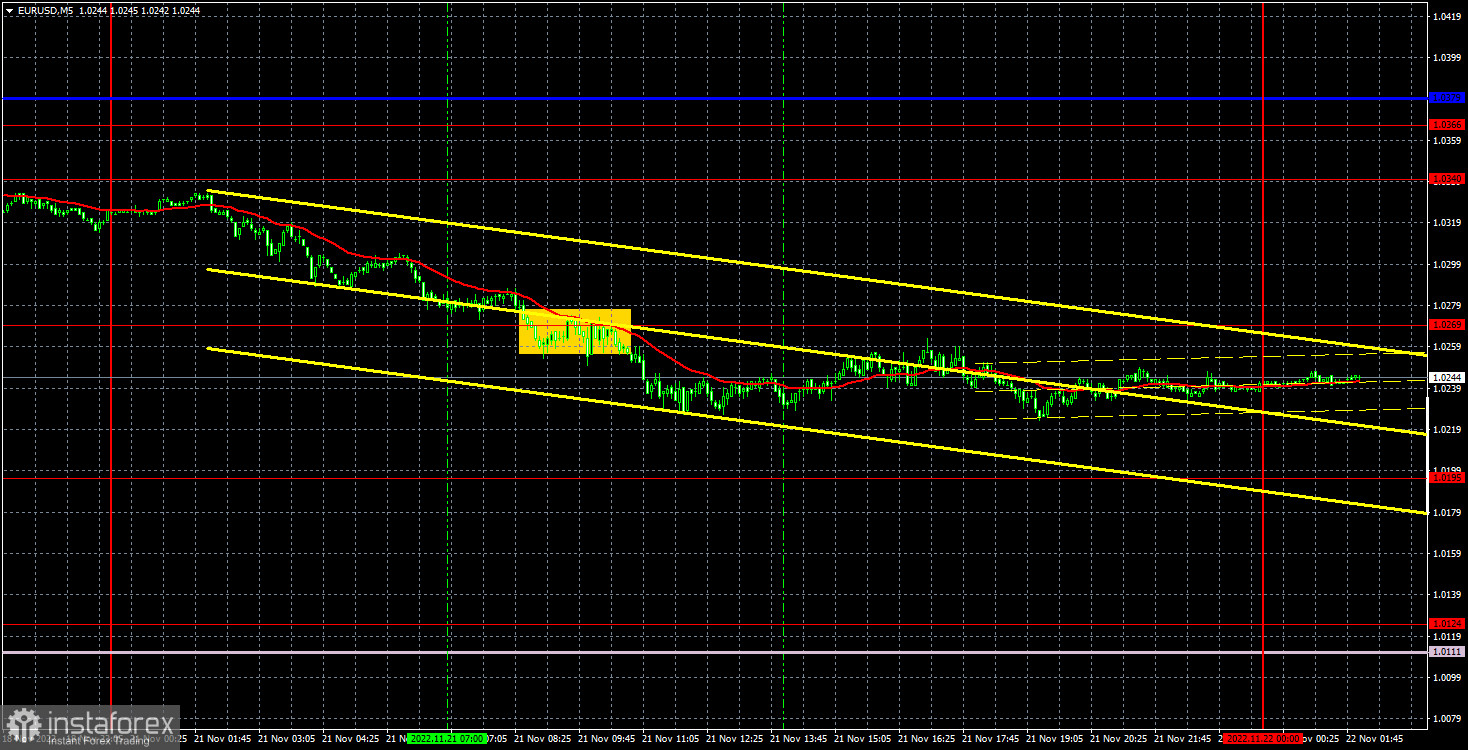
There was only one trade signal on Monday. The pair crossed the level of 1.0269 during the European trading session, and then managed to move down by 30 pips at the most. Therefore, you couldn't lose on the open trade, and the profit, if there was one, was minimal. However, a small profit is better than a loss.
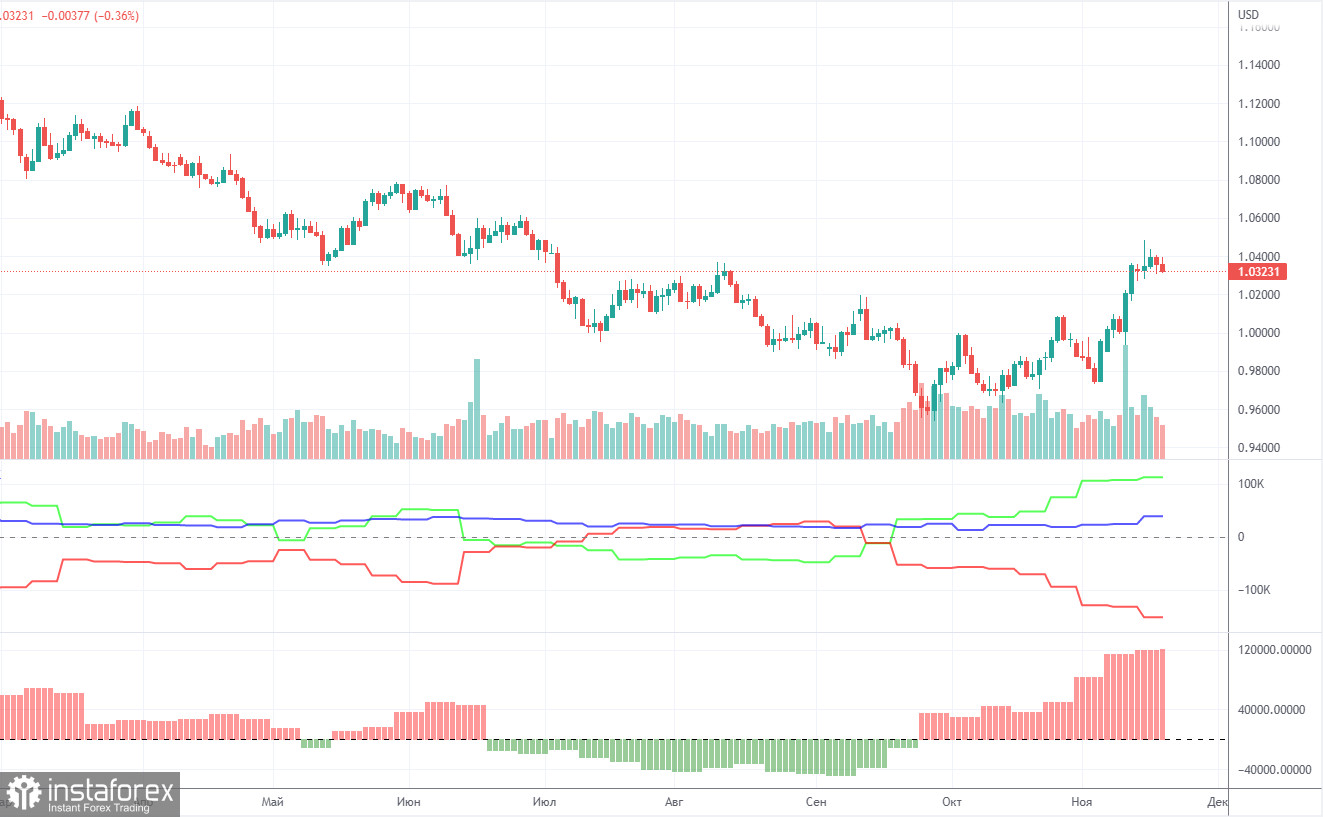
The Commitment of Traders (COT) reports on the euro in 2022 are a paradox. Halfway through the year they showed an outright bullish mood of commercial players, but at the same time the euro was falling steadily. Then for a few months they showed a bearish mood, and the euro also steadily fell. Now the net position of the non-commercial traders is bullish again and getting stronger, and the euro has hardly moved away from its 20-year lows. This is happening, as we said, because demand for the U.S. dollar remains very high amid the difficult geopolitical situation in the world. So even if the demand for the euro is rising, the high demand for the dollar still does not allow the euro itself to rise as much. In the given period, the number of long positions from the non-commercial group increased by 7,000, whereas the number of shorts - by 2,000. As a result, the net position increased by about 5,000 contracts. The euro has been slowly rising in recent weeks, which already coincides with the readings of the COT report. At the same time we think that the dollar will rise due to the same geopolitics or due to the lack of factors for the euro's growth. The green and red lines of the first indicator are far away from each other, which may indicate the end of the uptrend (which, in fact, never happened). The number of longs exceeds the number of shorts by 113,000. Thus, the net position of the non-commercial traders may go on rising but it may not provoke the same growth for the euro. If we look at the overall indicators of open longs and shorts across all categories of traders, then there are 39,000 more shorts (635,000 vs 596,000).
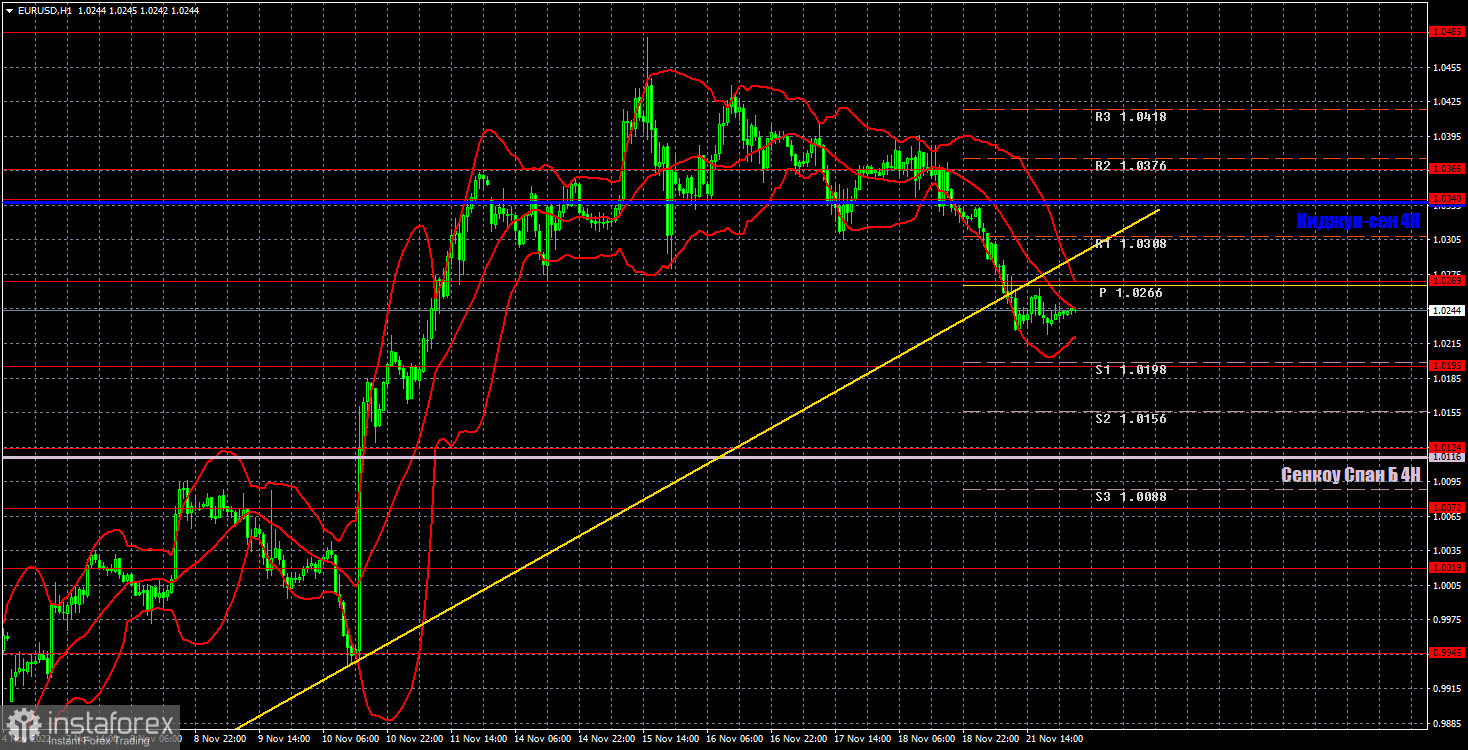
The EUR/USD pair started to move down on the one-hour chart, which we expected last week. There was a reason why the quotes fell yesterday, but we could not find any reason to back up the pair's strong growth a few weeks earlier. Therefore, at this time, the pair is returning to its balance, which was disrupted a few weeks ago. On Tuesday, the pair may trade at the following levels: 1.0072, 1.0119, 1.0195, 1.0269, 1.0340-1.0366, 1.0485, 1.0579, and also Senkou Span B lines (1.0116) and Kijun-Sen (1.0338). Lines of the Ichimoku indicator may move during the day, which should be taken into account when determining trading signals. There are also support and resistance levels, but signals are not formed near these levels. Bounces and breakouts of the extreme levels and lines could act as signals. Don't forget about stop-loss orders, if the price covers 15 pips in the right direction. This will prevent you from losses in case of a false signal. There are no important events scheduled in the EU and the USA for today. Therefore the market will have nothing to react to. High volatility is likely to persist and the price has technical reasons to continue falling.
Price levels of support and resistance are thick red lines, near which the movement may end. They do not provide trading signals.
The Kijun-sen and Senkou Span B lines are the lines of the Ichimoku indicator, moved to the one-hour chart from the 4-hour one. They are strong lines.
Extreme levels are thin red lines from which the price bounced earlier. They provide trading signals.
Yellow lines are trend lines, trend channels, and any other technical patterns.
Indicator 1 on the COT charts reflects the net position size of each category of traders.
Indicator 2 on the COT charts reflects the net position size for the non-commercial group.
*Анализът на пазара публикуван тук има за цел да повиши информираността Ви, но не и да дава указания за търговия.
Аналитичните прегледи на ИнстаФорекс ще ви запознаят изцяло с пазарните тенденции! Като клиент на ИнстаФорекс, на вас се предоставят голям брой безплатни услуги за ефикасна търговия.


