


Нашият екип има над 7 000 000 търговци!
Всеки ден работим заедно, за да подобрим търговията. Получаваме високи резултати и напредваме.
Признанието от милионите търговци по целия свят е най-доброто признание за нашата работа! Направихте своя избор и ние ще направим всичко, което е необходимо, за да отговорим на вашите очаквания!
Ние сме един страхотен екип заедно!
ИнстаФорекс. Горд съм да работя за вас!


Актьор, шампион на UFC 6 турнира и истински герой!
Човекът, който изгради себе си. Човекът, който върви по пътя ни.
Тайната зад успеха на Тактаров е постоянно движение към целта.
Открийте всички страни на вашия талант!
Откривайте, опитвайте, проваляйте се - но никога не спирайте!
ИнстаФорекс. Вашата успешна история започва тук!

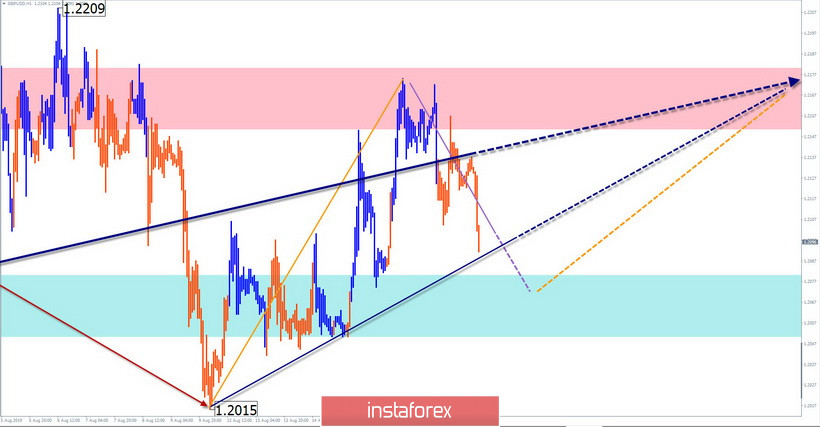
GBP/USD
Over the past 3 weeks, the price fluctuations of the British pound have been concentrated in a narrow side corridor. All this time, a bullish wave is forming a correction. The final part (C) is formed in the wave structure.
Forecast:
Today, consistent price movements are expected in a narrow price range. The current decline is likely to end in the morning. By the end of the day, you can expect to change the vector of movement, with the rise of prices to the resistance zone. The short-term puncture of the lower support border is not excluded.
Recommendations:
When selling a pair today, caution should be exercised due to the incompleteness of the current upward structure. In the area of the support zone, it is recommended to track reversal signals to find entry points to long positions.
Resistance zone:
- 1.2150/1.2180
Support zone:
- 1.2080/1.2050
USD/JPY
After the completed bullish correction wave since August 13, a new bearish wave has been developing on the yen chart. In recent days, the price forms the middle part (B), gaining the necessary wave level in the flat.
Forecast:
During the coming days, the completion of the bullish phase of the movement is expected. In the next session, a short-term decline is possible, which will then be replaced by an upward section.
Recommendations:
Until the full completion of the bullish structure, the price can dramatically change the rate, so the yen's sales are not promising today. For supporters of intraday, it is worth focusing on buying a pair. The rest are recommended to wait for the completion of the climb and to look for signals of sale of the instrument at its end.
Resistance zone:
- 106.70/107.00
Support zone:
- 106.10/105.80

Explanations to the figures: Waves in the simplified wave analysis consist of 3 parts (A-B-C). The last unfinished wave is analyzed. Zones show areas with the highest probability of reversal. The arrows indicate the wave marking according to the method used by the author, the solid background is the formed structure, the dotted ones are the expected movements.
Attention: The wave algorithm does not take into account the length of time the instrument moves.
*Анализът на пазара публикуван тук има за цел да повиши информираността Ви, но не и да дава указания за търговия.
Аналитичните прегледи на ИнстаФорекс ще ви запознаят изцяло с пазарните тенденции! Като клиент на ИнстаФорекс, на вас се предоставят голям брой безплатни услуги за ефикасна търговия.


