


Our team has over 7,000,000 traders!
Every day we work together to improve trading. We get high results and move forward.
Recognition by millions of traders all over the world is the best appreciation of our work! You made your choice and we will do everything it takes to meet your expectations!
We are a great team together!
InstaSpot. Proud to work for you!


Actor, UFC 6 tournament champion and a true hero!
The man who made himself. The man that goes our way.
The secret behind Taktarov's success is constant movement towards the goal.
Reveal all the sides of your talent!
Discover, try, fail - but never stop!
InstaSpot. Your success story starts here!

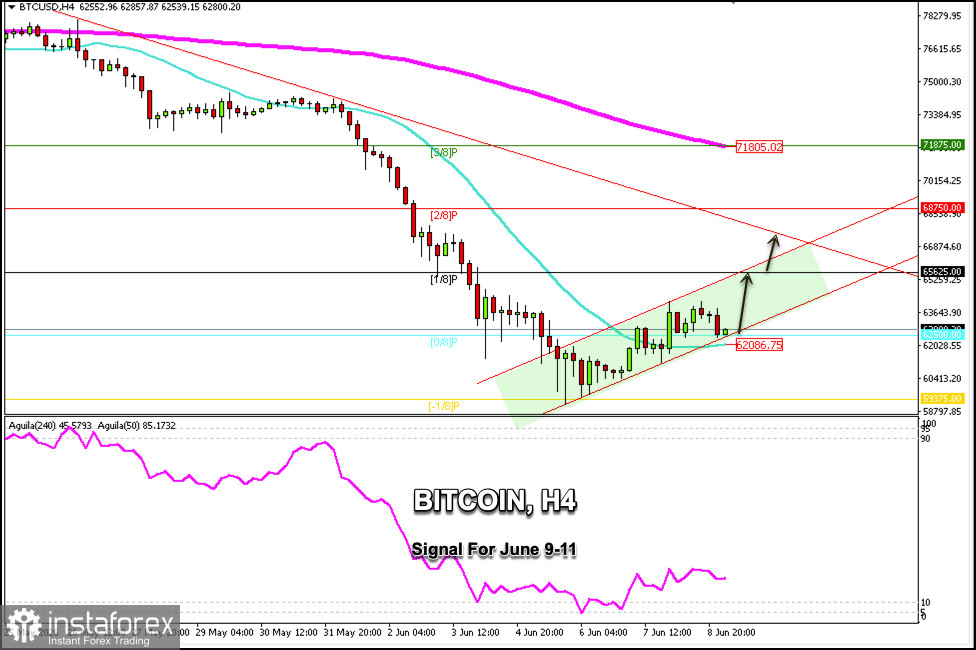
Bitcoin is trading around $62,800, undergoing a technical correction after reaching $64,000, following a rebound from the low of $59,375, which coincided with the -1/8 Murray level.
Bitcoin has reached a key support level. If the price remains above the 21 SMA and above the 0/8 Murray level, it could continue its rise in the coming days, potentially reaching the -1/8 Murray level around $65,625. BTC could even reach the upper band of the descending trend channel formed in May, around $66,875.
A sharp break below $62,000, along with consolidation below the 0/8 Murray level, could enable further declines in Bitcoin, potentially pushing it down to the $59,375 area. This level could form a double bottom pattern, which would entail bullish implications.
Given that Bitcoin is currently within an upward trend channel and above the 0/8 Murray level, we will look for buying opportunities in the coming days above $62,500, with a target at $65,625. Even if the bullish momentum prevails, we would expect it to reach the 2/8 Murray level around $68,750.
The Eagle indicator is showing a positive signal. So, any pullback in Bitcoin as long as the price remains above $59,375, will be seen as a bullish signal to continue buying.
*এখানে পোস্ট করা মার্কেট বিশ্লেষণ আপনার সচেতনতা বৃদ্ধির জন্য প্রদান করা হয়, ট্রেড করার নির্দেশনা প্রদানের জন্য প্রদান করা হয় না।
ইন্সটাফরেক্স বিশ্লেষণমূলক পর্যালোচনাগুলো আপনাকে মার্কেট প্রবণতা সম্পর্কে পুরোপুরি সচেতন করবে! ইন্সটাফরেক্সের একজন গ্রাহক হওয়ায়, দক্ষ ট্রেডিং এর জন্য আপনাকে অনেক সেবা বিনামূল্যে প্রদান করা হয়।


